
Ransomware payments tell a story of contradictions. In 2024, total global ransom payments dropped 35% year-over-year to $813.55 million — yet the average payout for those who did pay hit $2 million, a 500% increase from the prior year. The record fell in the same period: a Fortune 50 company handed $75 million to a single criminal group. As fewer organizations pay, those who do are paying more than ever. This article compiles the most current ransomware payout statistics drawn exclusively from Tier 1 primary sources — Chainalysis, FBI IC3, FinCEN, Coveware, Sophos, Verizon DBIR, and IBM — to give IT leaders, security professionals, and business owners the full picture heading into 2026.
Key Takeaways: Ransomware Payout Statistics 2026
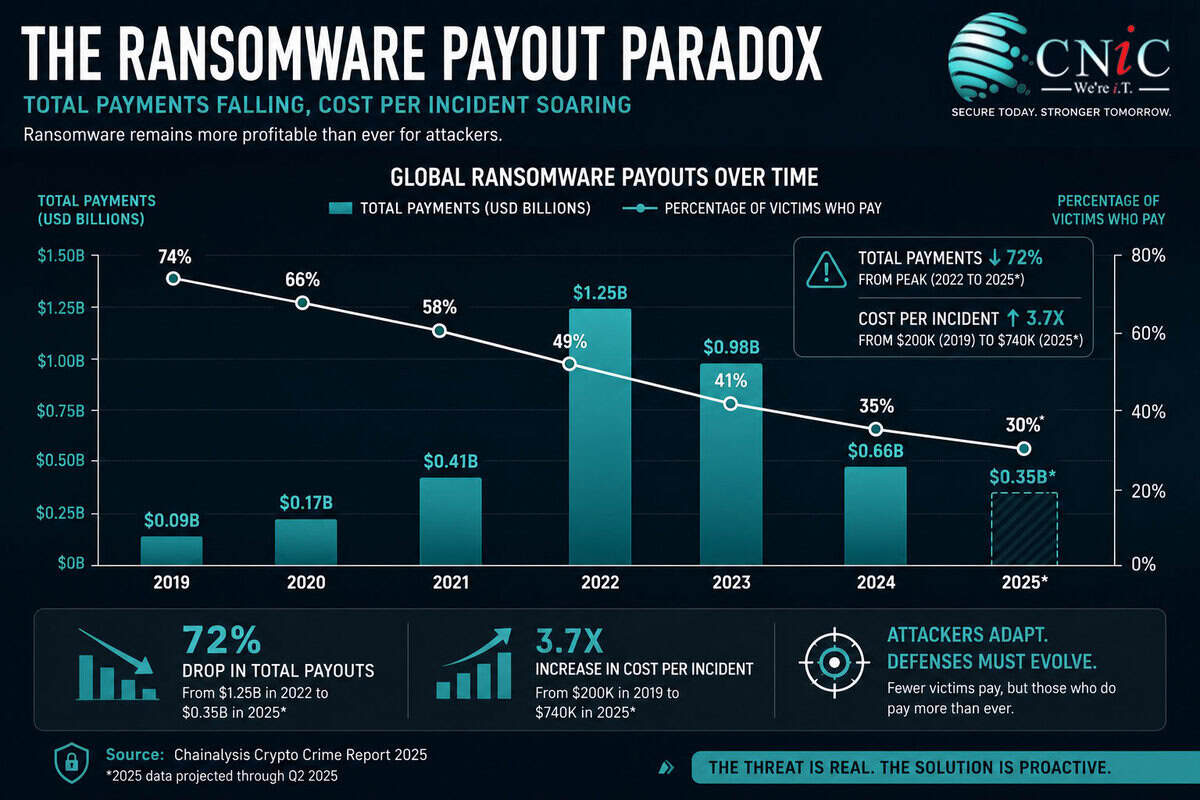
- Total global ransomware payments fell 35% to $813.55 million in 2024, down from a record $1.25 billion in 2023 (Chainalysis).
- Only 25% of victims paid a ransom in Q4 2024 — the lowest rate ever recorded (Coveware).
- The average payment doubled to $2 million in 2024, up from $400,000 in 2023, as attackers shifted to high-value enterprise targets (Sophos).
- The record single payment: $75 million — paid to the Dark Angels group by an unnamed Fortune 50 company in 2024 (Chainalysis / Mandiant).
- 84% of paying victims failed to fully recover their data in Q4 2024 (Halcyon).
- The FBI has saved organizations $800M+ in avoided ransom payments since 2022 through decryption key programs (FBI IC3 2024 Annual Report).
- FinCEN tracked $2.1 billion in ransomware payments over just three years (2022–2024) via Bank Secrecy Act filings.
Global Ransomware Payment Totals and Trends (2019–2025)
After reaching an unprecedented peak in 2023, the total volume of money flowing to ransomware criminals reversed course in 2024. Chainalysis — the gold standard for blockchain-traced cryptocurrency payment data — recorded a 35% year-over-year decline, with ransomware attackers receiving approximately $813.55 million in payments from victims in 2024, down from 2023’s record-setting $1.25 billion.
The decline was not linear. The first half of 2024 was on pace for the worst year on record — by June, $459.8 million had already been extorted, driven in part by the record-breaking $75 million Dark Angels payment. The second half of the year saw payment activity slow dramatically, dropping approximately 34.9% after July — the steepest mid-year decline observed since 2021.
Global Ransomware Payments by Year (Chainalysis)
FinCEN’s Financial Trend Analysis provides complementary data from the U.S. banking system. During the three-year period from January 2022 through December 2024, FinCEN received 7,395 Bank Secrecy Act reports related to 4,194 ransomware incidents totaling more than $2.1 billion. The median amount of a single ransomware transaction tracked through BSA filings was $124,097 in 2022, rising to $175,000 in 2023, then falling back to $155,257 in 2024 — consistent with the broader market fragmentation caused by law enforcement disruptions of major RaaS operators.
Source: Chainalysis 2025 Crypto Crime Report | FinCEN Financial Trend Analysis on Ransomware, December 2024
Explore CNiC’s Cybersecurity Services →
CNiC Analysis: What Attackers Actually Earn Per Attack
Chainalysis confirmed $813.55 million in total ransomware payments in 2024.
Comparitech identified 5,260+ successful ransomware attacks that same year.
Dividing total payments by total attacks yields an average attacker yield of approximately $154,600 per attack — including all the victims who refused to pay.
This figure matters because it reframes the economics from the attacker’s perspective. Even with 64–75% of victims refusing to pay, ransomware remains highly profitable per campaign. For attackers running volume-based operations against SMBs, a $154K average yield across hundreds of attacks is a sustainable criminal business model — which is exactly why attack frequency keeps rising even as payment rates fall.
CNiC-derived calculation: $813,550,000 (Chainalysis 2025) ÷ 5,260
(Comparitech 2024 confirmed attacks) = ~$154,600 per attack. Sources used in isolation; calculation and interpretation original to CNiC Solutions.
Average vs. Median Ransomware Payments: The Numbers Behind the Headlines
No statistic in the ransomware landscape is more misunderstood than the “average” payment. The average is driven skyward by a small number of catastrophic payouts against Fortune 500 companies and critical infrastructure. The median — the number right in the middle of all reported payments — tells you what the typical victim actually experiences.
| Time Period | Average Payment | Median Payment | Source |
|---|---|---|---|
| 2023 (annual) | $400,000 | $150,000 | Sophos / Verizon DBIR |
| Q1 2024 | $381,980 | $250,000 (all-time high) | Coveware |
| Q3 2024 | ~$477,000 | ~$200,000 | Coveware |
| Q4 2024 | $553,959 (+16% QoQ) | $110,890 (−45% QoQ) | Coveware |
| 2024 (annual avg) | $2,000,000 | $115,000 | Sophos / Verizon DBIR 2025 |
| 2025 (annual avg) | $1,000,000 (−50%) | ~$325,000 (Q4 2025) | Sophos / Coveware |
The divergence between average and median reveals the bifurcated nature of modern ransomware. “Big game hunting” groups target large enterprises and demand eight-figure sums, pulling the average up dramatically. Meanwhile, the fragmented ecosystem of smaller RaaS affiliates — proliferating after the dismantling of LockBit and ALPHV/BlackCat — is targeting mid-sized organizations with lower demands, keeping the median comparatively suppressed.
Critically, victims negotiate aggressively. Coveware data shows that actual payments average approximately 8.7% of initial demands. The median demand in 2025 was $1.32 million (Sophos); the median payment was around $110,000–$115,000. This negotiation gap is widening, reflecting greater victim sophistication, professional negotiators engaged through cyber insurance policies, and growing distrust that attackers will actually honor deletion promises.
Source: Coveware Q4 2024 Ransomware Report | Sophos State of Ransomware 2025
See How Proper Backups Eliminate Ransom Leverage →
The Decision to Pay: Who Pays, Who Refuses, and Why It Matters
The most significant trend in ransomware economics over the past four years is the steady, accelerating decline in the proportion of victims who choose to pay. This shift is having a direct financial impact on criminal operations and is forcing attackers to change tactics.
Share of Victims Refusing to Pay — Annual Trend
Why are organizations increasingly refusing to pay? Multiple converging factors:
Better backup infrastructure. Coveware’s data shows that encryption as an extortion method is becoming less effective as organizations improve hardening measures and backup and recovery processes. In 2025, 53% of organizations fully recovered from a ransomware attack within one week — up from 35% in 2024 (Sophos).
Law enforcement disruption. The FBI obtained over 7,000 LockBit decryption keys following Operation Cronos and made them available to victims for free. Since 2022, the FBI has offered thousands of decryption keys, helping organizations avoid over $800 million in ransom payments. Coveware noted Q4 2024 was “a banner quarter for global law enforcement,” with significant arrests and takedowns including LockBit affiliates, the Redline and Meta Infostealer platforms, and Phobos affiliate Evgenii Ptitsyn.
Regulatory pressure. Growing regulatory guidance across multiple industries discourages ransom payment, particularly for critical infrastructure. Organizations also face legal risk — the U.S. Treasury’s Office of Foreign Assets Control (OFAC) sanctions program means paying certain groups may constitute illegal activity.
Distrust of attackers. FBI confirmed that LockBit retained stolen data even after victims paid ransoms, only removing the data from its public leak site. The ALPHV/BlackCat group executed an “exit scam” after receiving the $22 million Change Healthcare payment, pocketing the money and failing to pay the affiliate — who then sold the data to RansomHub.
Source: FBI IC3 2024 Annual Crime Report | Coveware Q4 2024 Ransomware Quarterly Report
Learn How AI-Enhanced Security Reduces Ransomware Risk →
Ransomware Payout Statistics by Industry (2024–2025)
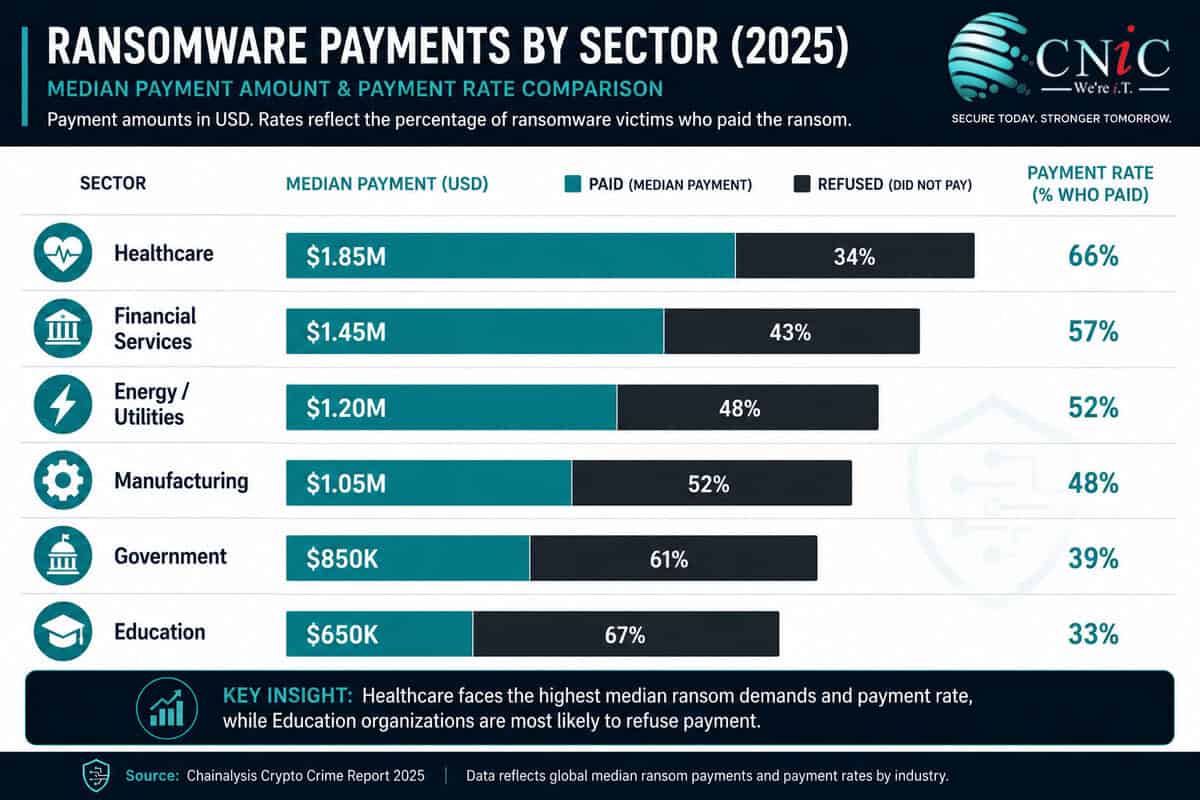
Ransomware groups are not equal-opportunity attackers. They select targets based on perceived ability to pay, sensitivity of data, and operational dependency on uptime. The result: dramatic variation in payment rates and amounts across sectors.
| Industry | Attack Rate (2024) | % Who Paid | Median Ransom Payment | Source |
|---|---|---|---|---|
| Healthcare | 67% | 53% | $1.5M (avg $4.4M) | Sophos 2024 |
| Energy / Utilities | 67% | High | $2.5M | Sophos 2024 |
| Financial Services | 65% | 51% | $2.0M (median demand) | Sophos 2024 |
| Manufacturing | High | 62% | Varies by incident | FinCEN / Coveware |
| State/Local Govt | 34% | Varies | $2.5M (2025 Sophos) | Sophos 2025 |
| Education | Elevated | Lower | Lower than enterprise | Sophos 2024 |
Healthcare: The Costliest Target. Sophos’s healthcare-specific 2024 report found that 67% of healthcare organizations were hit by ransomware — nearly double the 34% rate in 2021. Of those whose data was encrypted, 53% paid the ransom. The average (median) payment among those who disclosed it was $1.5 million; the average skyrocketed to $4.4 million, reflecting catastrophic payouts like UnitedHealth’s $22 million payment following the Change Healthcare attack. Attackers were also particularly effective at neutralizing defenses: 66% of attempted backup compromises in healthcare succeeded, the highest rate of any sector except energy/utilities and education.
FinCEN’s Three-Year Ledger. Looking at cumulative totals across the 2022–2024 period tracked via BSA filings, financial services reported the highest total payments at $365.6 million across 432 incidents, despite having robust defenses. Manufacturing followed at $284.6 million across 456 incidents, and healthcare at $305.4 million across 389 incidents. The manufacturing sector’s high incident count combined with high payment frequency reflects the operational pressure attackers exploit — production downtime creates immediate financial pressure to pay.
Energy and Utilities: New Willingness to Pay. In a notable shift, Sophos’s 2024 critical infrastructure report found that for the first time, energy, oil/gas and utilities organizations reported a higher propensity to pay the ransom than to use backups. The sector’s median payment was $2.5 million, with 48% paying the original demand — the highest “full payment” rate across all surveyed sectors.
Source: Sophos State of Ransomware in Healthcare 2024 | FinCEN Ransomware Trend Analysis 2024
See CNiC’s Industry-Specific IT Security Solutions →
The Aftermath: What Happens to Organizations That Pay
The most important question about ransomware payouts isn’t how much — it’s what happens next. The data is clear and unambiguous: paying does not buy safety, and it often does not even buy data recovery.
The decision to pay is frequently made under extreme time pressure. Halcyon’s research shows that 75% of paying victims transferred funds within 48 hours of the attack — before they’ve had adequate time to assess alternatives, contact law enforcement, or engage professional negotiators. This compressed timeline is a deliberate attacker strategy designed to maximize panic and minimize victim deliberation.
The payment-then-repeat-attack cycle is well-documented. Cybereason’s research found that 80% of organizations that paid a ransom were attacked a second time, with 68% experiencing that second attack within the same month — often at a higher demand. Attackers treat payment as proof of willingness to pay again, and they share victim profiles within criminal ecosystems.
Data recovery outcomes after paying are troubling even when decryption tools are provided:
| Outcome After Paying | Finding | Source |
|---|---|---|
| Full data recovery | Only 4% recover ALL data | Fortinet 2024 |
| Failed to fully recover | 84% of paying victims (Q4 2024) | Halcyon |
| Healthcare data restored | Average 64.8% of data recovered | Sophos (healthcare) |
| Re-attacked within 12 months | 80% of paying organizations | Fortinet 2024 |
| Re-attacked within same month | 68% of those re-attacked | Cybereason |
| Attacker deleted data after payment | Not confirmed for LockBit victims | FBI / Operation Cronos |
The total cost of an attack far exceeds the ransom itself. IBM’s 2025 Cost of a Data Breach Report put the average total cost of a ransomware incident at $5.08 million — making it the single most expensive initial attack vector tracked, and that figure often excludes the ransom payment itself in methodology. The average recovery cost excluding the ransom was $1.53 million in 2025 (Sophos), down 44% from $2.73 million in 2024, reflecting improving backup and recovery capabilities.
Source: Sophos State of Ransomware 2025
Build an Immutable Backup Strategy with CNiC →
Law Enforcement Impact on Ransomware Payouts
The most encouraging development in the ransomware payout landscape over the past two years is the measurable, documented impact of law enforcement action. Disruptions to LockBit and ALPHV/BlackCat, the two dominant RaaS operators of 2022–2023, directly contributed to the 35% payment decline in 2024 — and the provision of free decryption keys has helped thousands of victims avoid paying entirely.
Operation Cronos — led by the UK National Crime Agency with FBI involvement — executed in February 2024, seized 34 servers and over 2,500 decryption keys, and took control of LockBit’s dark web infrastructure. LockBit had been the most prolific ransomware group since 2022, responsible for over 7,000 attacks and an estimated $1 billion+ in collected ransoms. While the group has attempted to rebuild, its dominance evaporated: LockBit’s H2 2024 payments declined by approximately 79%, according to Chainalysis — among the clearest proof points of law enforcement’s financial impact on ransomware ecosystems.
The ALPHV/BlackCat disruption, while complicated by the group’s exit scam after the Change Healthcare payment, also fragmented a massive affiliate network. Those affiliates didn’t retire — they migrated to surviving groups like RansomHub (which became the most prolific group by victim count in 2024) or went independent, but the organizational capacity to execute large, coordinated attacks was temporarily degraded.
Major Law Enforcement Actions vs. Payment Impact (2024)
Policy is catching up with practice. The UK has proposed a ban on ransom payments in the public sector. In the United States, OFAC sanctions make it potentially illegal to pay certain ransomware groups without prior authorization. The FBI’s Internet Crime Complaint Center actively encourages victims to report rather than pay, and Operation Level Up in 2024 specifically targeted cryptocurrency infrastructure used by ransomware operators. IC3 received 3,156 ransomware complaints in 2024 — a 9% increase from 2023 — though this still represents a significant undercount of actual incidents, as many victims report directly to field offices or not at all.
Source: FBI IC3 2024 Annual Report | Chainalysis 2025 Crypto Crime Report
Get a Ransomware Preparedness Assessment from CNiC’s vCIO Team →
The True Cost of Ransomware: Beyond the Ransom Payment
Focusing only on ransom payments dramatically understates the financial damage of a ransomware incident. The ransom itself is typically the smallest component of total attack cost. IBM’s 2025 Cost of a Data Breach Report, which surveyed organizations across multiple regions, found that the average total cost of a ransomware breach was $5.08 million — making ransomware the most expensive initial attack vector tracked, above social engineering, phishing, and all other breach types.
| Cost Component | Detail | Source |
|---|---|---|
| Ransom payment | Avg $1M (2025); median $110K–$325K | Sophos / Coveware |
| Recovery costs (excl. ransom) | $1.53M average (2025) | Sophos SOR 2025 |
| Total breach cost | $5.08M average | IBM Cost of Breach 2025 |
| Healthcare breach cost | $7.42M average (2025) | IBM Cost of Breach 2025 |
| Downtime | 24 days average | Statista |
| Healthcare daily downtime cost | $900,000/day | Microsoft Security Insider |
| Recovery time improvement | 53% recovered in <1 week (2025), up from 35% (2024) | Sophos SOR 2025 |
The comparison between ransom payment and total recovery cost reveals why paying is rarely the fiscally rational choice even from a pure economics standpoint. An organization that pays a $1 million ransom still faces $1.53 million in recovery costs on top of that — plus the 24-day average downtime, regulatory notification costs, legal exposure, reputational damage, and cyber insurance premium increases. The Change Healthcare attack illustrates this at scale: the $22 million ransom payment paled in comparison to UnitedHealth Group’s total 2024 losses of approximately $3 billion attributed to the incident.
There is measurable value in prevention investment. IBM’s research consistently shows that organizations with mature AI and automation in their security stack contain breaches 98 days faster than average and save close to $1 million per incident. AI-driven defensive tools detect the behavioral indicators of ransomware — lateral movement, mass file encryption, exfiltration — far earlier in the attack chain, when disruption is cheapest.
Source: IBM Cost of a Data Breach Report 2025 | Sophos State of Ransomware 2025
See How Managed IT Reduces Your Total Ransomware Risk →
Ransomware Payout Statistics Summary (2026 Reference Table)
| Statistic | Data Point | Source | Year |
|---|---|---|---|
| Total global ransom payments | $813.55 million (−35% YoY) | Chainalysis | 2024 |
| Prior year total (record high) | $1.25 billion | Chainalysis | 2023 |
| BSA-reported ransomware payments (3 yrs) | $2.1 billion (4,194 incidents) | FinCEN | 2022–2024 |
| Average ransom payment (annual) | $2M (2024); $1M (2025, −50%) | Sophos SOR 2024/2025 | 2024–2025 |
| Median ransom payment | $110,890 (Q4 2024); $325,000 (Q4 2025) | Coveware | 2024–2025 |
| Median ransom demand (2025) | $1.32 million | Sophos SOR 2025 | 2025 |
| Negotiation ratio | ~8.7% of initial demand | Coveware | 2024 |
| Largest single ransom payment | $75 million (Dark Angels) | Chainalysis / Mandiant | 2024 |
| Payment refusal rate | 64% refused in 2024 (Verizon); 75% in Q4 2024 (Coveware) | Verizon DBIR 2025 / Coveware | 2024 |
| Payment rate (record low) | 25% paid in Q4 2024 | Coveware | Q4 2024 |
| FBI decryption keys (LockBit) | 7,000+ keys; $800M+ in avoided payments | FBI IC3 2024 Report | 2022–2024 |
| LockBit H2 2024 payment decline | −79% after Operation Cronos | Chainalysis | 2024 |
| Failed full data recovery after paying | 84% of paying victims | Halcyon Q4 2024 | Q4 2024 |
| Re-attacked within 12 months after paying | 80% of organizations | Fortinet 2024 | 2024 |
| Victims who paid within 48 hours | 75% | Halcyon | Q4 2024 |
| Total cost of ransomware breach | $5.08 million average | IBM Cost of Breach 2025 | 2025 |
| Recovery cost (excl. ransom) | $1.53 million average (down 44%) | Sophos SOR 2025 | 2025 |
| Average downtime | 24 days | Statista | 2024 |
| Healthcare: organizations attacked | 67% | Sophos SOR Healthcare 2024 | 2024 |
| Healthcare: median ransom paid | $1.5M; avg $4.4M | Sophos SOR Healthcare 2024 | 2024 |
| Energy/utilities: median ransom paid | $2.5M | Sophos SOR Critical Infrastructure 2024 | 2024 |
| Financial services: total BSA payments (3yr) | $365.6M (432 incidents) | FinCEN | 2022–2024 |
| Manufacturing: total BSA payments (3yr) | $284.6M (456 incidents) | FinCEN | 2022–2024 |
| Healthcare: total BSA payments (3yr) | $305.4M (389 incidents) | FinCEN | 2022–2024 |
| Organizations that negotiated lower payment | 53% | Sophos SOR 2025 | 2025 |
| IC3 ransomware complaints (2024) | 3,156 (+9% from 2023) | FBI IC3 2024 | 2024 |
Frequently Asked Questions: Ransomware Payouts
Methodology & Sources
All statistics in this article are sourced directly from Tier 1 primary sources: government agencies, peer-reviewed researchers, and organizations that collect raw incident data. No blog-to-blog citations or secondary aggregators were used as primary references. Data points are attributed to the specific report edition from which they originate. Where statistics vary between sources due to different methodologies (e.g., Chainalysis blockchain data vs. Sophos survey data vs. FinCEN BSA filings), the methodology differences are noted in context.
Primary Sources Referenced:
- Chainalysis 2025 Crypto Crime Report — On-chain blockchain analysis of cryptocurrency ransomware payments globally. chainalysis.com
- FBI Internet Crime Complaint Center (IC3) 2024 Annual Report — U.S. government self-reported cybercrime complaint data. ic3.gov
- FinCEN Financial Trend Analysis on Ransomware (December 2024) — U.S. Treasury Bank Secrecy Act filing data, 2022–2024. fincen.gov
- Coveware Q4 2024 Ransomware Report — Incident response case data from ransomware negotiation firm. coveware.com
- Sophos State of Ransomware 2024 and 2025 — Annual survey of 5,000 IT/cybersecurity leaders across 14 countries. sophos.com
- Sophos State of Ransomware in Healthcare 2024 — Sector-specific survey data on healthcare ransomware impacts and payments.
- Sophos State of Ransomware in Critical Infrastructure 2024 — Energy, oil/gas, and utilities sector survey data.
- Verizon 2025 Data Breach Investigations Report (DBIR) — Annual analysis of confirmed data breach incidents globally.
- IBM Cost of a Data Breach Report 2025 — Annual quantitative research on breach costs across industries and geographies.
- Halcyon Ransomware Research (Q4 2024) — Incident response and threat intelligence data on ransomware outcomes.
- Fortinet 2024 Ransomware Report — Global threat research on ransomware payment outcomes and re-attack rates.
- Mandiant M-Trends 2025 — Incident response data including documentation of the $75M Dark Angels payment.
This article was researched and published by CNiC Solutions, a Houston-based managed IT and cybersecurity provider. Content is updated as new primary source data becomes available. Last updated: May 2026.

related posts
What Is DRaaS (Disaster Recovery as a Service)?
June 25, 2026DRaaS (Disaster Recovery as a Service) is a cloud-based model in which a third-party provider replicates…
What Is a Virtual CIO and Why You Need One
June 25, 2026A Virtual CIO (vCIO) is an outsourced technology executive who provides the same strategic IT leadership…
What Are Bots? Good Bots, Bad Bots, and How to Defend Against…
June 25, 2026A bot is an automated software program that carries out predefined tasks without human intervention, working…
IT Compliance Checklist for Small Business
June 25, 2026An IT compliance checklist turns a wall of regulations into a set of specific, assignable tasks…