
Data breaches in 2024 didn’t break the record — but they broke something arguably more alarming. The number of U.S. breaches was nearly identical to 2023’s all-time high, yet the number of people notified of exposure exploded by 312%, reaching 1.73 billion victim notices. Six mega-breaches — each exposing over 100 million records — drove that surge: Ticketmaster, AT&T, Change Healthcare, Advanced Auto Parts, and others. Meanwhile, Verizon’s 2025 DBIR confirmed 12,195 data breaches globally from the largest dataset in the report’s history, with third-party and supply chain involvement doubling to 30% of all breaches. This article compiles the definitive data breach statistics for 2026 from Tier 1 primary sources — ITRC, Verizon DBIR, IBM, Mandiant M-Trends, and the FBI IC3 — covering frequency, causes, industries, detection timelines, and what’s actually driving exposure. For the financial cost of breaches, see our companion article on the Average Cost of a Data Breach Statistics 2026.
Key Takeaways: Data Breach Statistics 2026
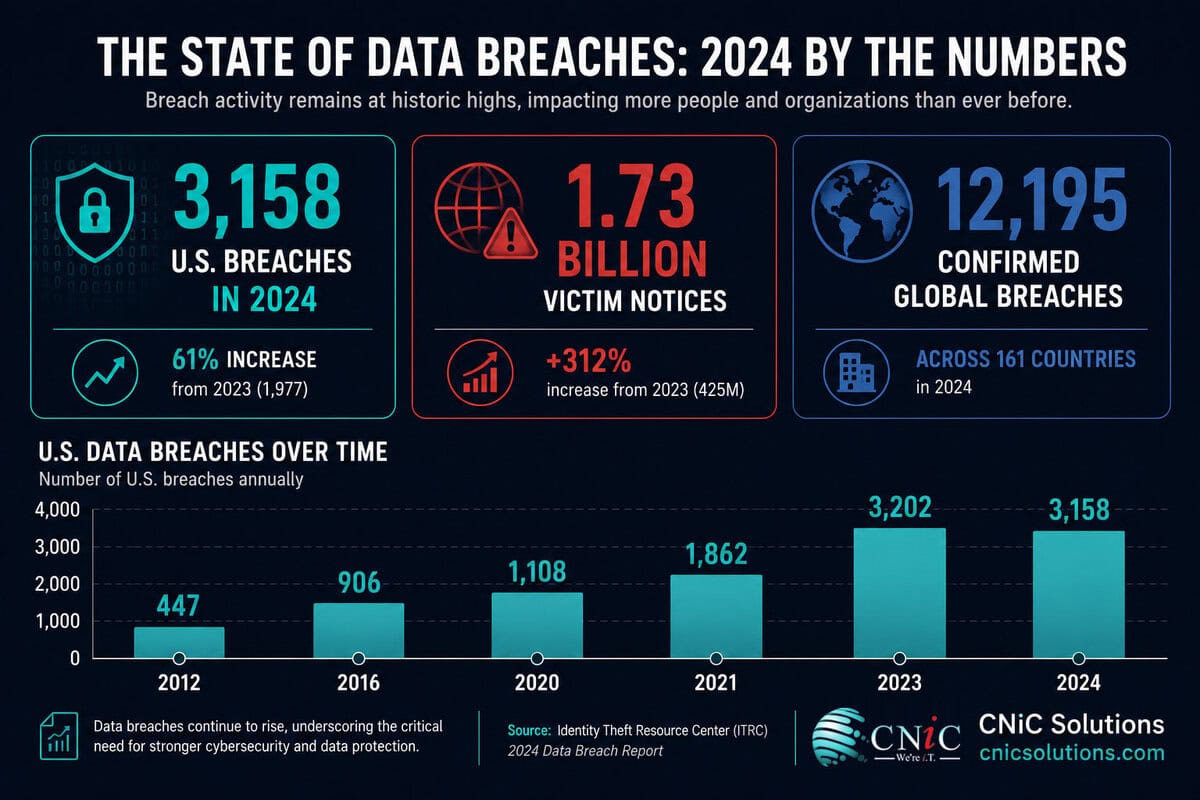
- 3,158 U.S. data compromises in 2024 — just 44 short of the all-time record, despite a 1% decrease from 2023 (ITRC 2024 Annual Data Breach Report).
- 1.73 billion victim notices issued in 2024 — a 312% jump from 2023, driven by six mega-breaches each exceeding 100 million notices (ITRC 2024).
- 12,195 confirmed global breaches analyzed in Verizon’s 2025 DBIR — the largest dataset in the report’s 18-year history, across 139 countries.
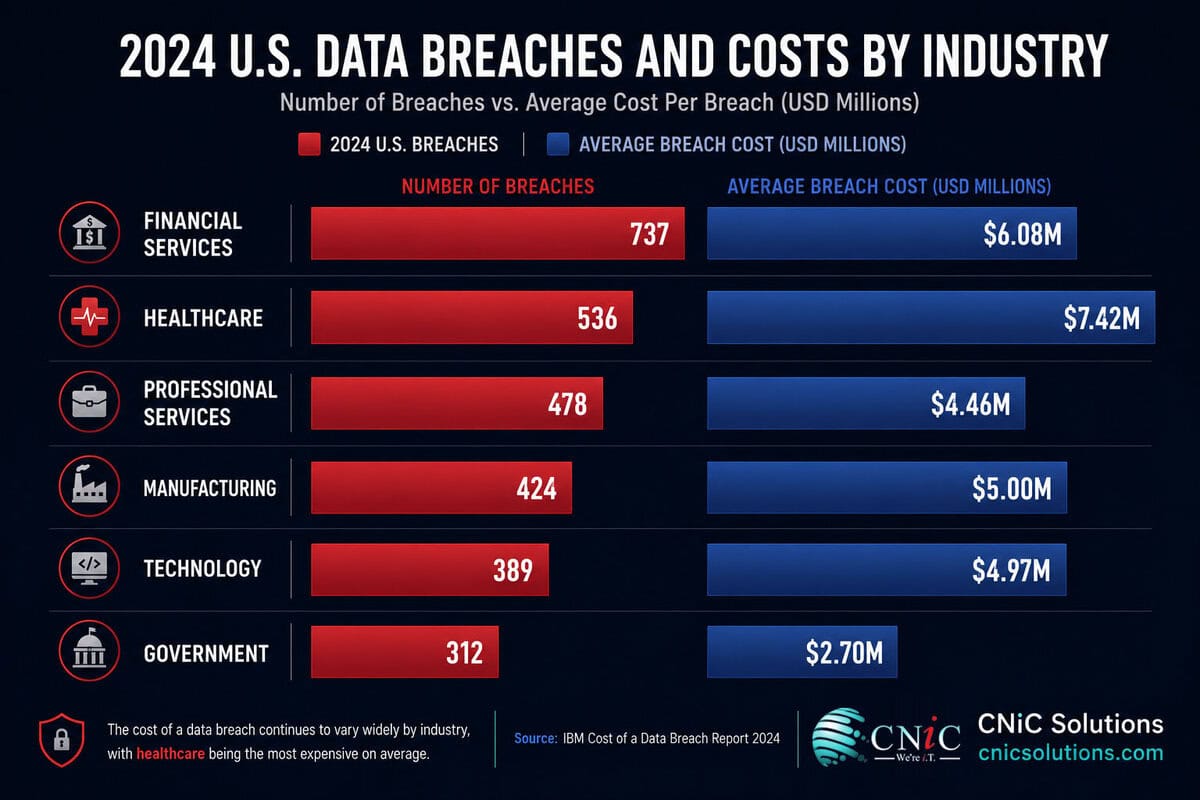
- Financial services displaced healthcare as the most breached U.S. industry in 2024 for the first time since 2018, with 737 compromises — up 67% year-over-year (ITRC 2024).
- Third-party and supply chain involvement doubled to 30% of all breaches in 2025, up from 15% the prior year (Verizon DBIR 2025).
- 74% of breach notices failed to disclose the attack vector — making it nearly impossible for organizations to learn from peers’ incidents (ITRC 2024).
- 4 of the 6 mega-breaches in 2024 were preventable with MFA or passkeys — including Ticketmaster, AT&T, Change Healthcare, and Advanced Auto Parts (ITRC 2024).
Data Breach Frequency: How Many Breaches Happen and How Big They’re Getting
Understanding the scale of the data breach problem requires looking at two separate metrics: the number of discrete incidents (breach count) and the number of people affected (victim notices). In 2024, these two metrics told dramatically different stories — and the divergence reveals something important about how the threat landscape has shifted.
The ITRC’s 2024 Annual Data Breach Report — tracking all publicly reported U.S. data compromises since 2005 — found 3,158 events in 2024, marginally below the record 3,202 set in 2023. The near-flat breach count, however, obscures a seismic shift in impact. Six “mega-breaches” each generated over 100 million victim notices:
| Mega-Breach (2024) | Approximate Victim Notices | Key Factor |
|---|---|---|
| Ticketmaster Entertainment | ~560 million | Stolen credentials; preventable with MFA |
| Change Healthcare (UnitedHealth) | ~190 million | Ransomware; largest healthcare breach in U.S. history |
| AT&T | 100 million+ | Stolen credentials; preventable with MFA |
| Advanced Auto Parts | 100 million+ | Stolen credentials; preventable with MFA |
| National Public Data | 100 million+ | Data aggregator breach; 2.9B records exposed |
| Additional mega-breach | 100 million+ | Supply chain / third-party vector |
These six events alone accounted for approximately 85% of all 2024 victim notices. When they are excluded, the remaining ~266 million victim notices actually represent a 36% decrease from 2023 — meaning the overall breach landscape excluding mega-events improved, while the catastrophic tail grew worse. ITRC President James E. Lee summarized the situation: “The number of people and businesses who have not been impacted by a data breach is now dwarfed by the number of victims who have been — by a factor of five.”
U.S. Data Breach Count Growth (ITRC Annual Reports)
Globally, Verizon’s 2025 DBIR — which analyzed 22,052 security incidents and 12,195 confirmed breaches across 139 countries — represents the most comprehensive breach dataset ever compiled in the report’s 18-year history. Ransomware was present in 44% of all confirmed breaches, up sharply from 32% the prior year. Third-party involvement doubled from 15% to 30% of all breaches, making supply chain and vendor compromise the defining structural shift of the current breach landscape.
In 2024, just 6 breaches out of 3,158 total U.S. compromises — representing 0.19% of all events — generated 85% of all victim notices (approximately 1.47 billion of 1.73 billion). The remaining 3,152 breaches generated only 266 million notices combined. This extreme concentration means that traditional “breach count” statistics significantly understate the actual population impact of data breaches. A single poorly-secured cloud credential at a large data aggregator or payment processor can generate more victim exposure than thousands of smaller incidents combined. This is precisely why the ITRC identifies MFA and passkey adoption as the highest-ROI preventive investment: 4 of the 6 mega-breaches were preventable with credential controls already commercially available.
CNiC-derived calculation: 6 ÷ 3,158 total breaches = 0.19% of events; 1.47B ÷ 1.73B notices = 85% of victim impact. Sources: ITRC 2024 Annual Data Breach Report. Interpretation original to CNiC Solutions.
Source: ITRC 2024 Annual Data Breach Report | Verizon 2025 Data Breach Investigations Report
Protect Your Business from Data Breaches with CNiC →
What Causes Data Breaches: Root Causes and Initial Access Vectors
Every breach has a point of entry. The root cause data from 2024–2025 reveals that the same three vectors — stolen credentials, phishing, and vulnerability exploitation — account for the overwhelming majority of initial access. More troubling: a growing percentage of breach notices provide no information about how the attack happened at all.
Verizon’s 2025 DBIR identifies three primary initial access pathways across all analyzed breaches: credential abuse (22%), exploitation of vulnerabilities (20%), and phishing (16%). IBM’s 2025 Cost of a Data Breach Report, which analyzes breach costs by initial vector, found phishing as the leading initial access vector in 16% of studied incidents. Mandiant’s M-Trends 2025 — drawn from active incident response engagements — shows a somewhat different distribution reflecting targeted attack patterns: exploitation (33%), stolen credentials (16%), and email phishing (14%).
Primary Initial Access Vectors — Verizon DBIR 2025 (Known Vectors)
Stolen Credentials: The Access Problem. The ITRC’s analysis of the 2024 mega-breaches crystallizes the credential problem: four of the six largest breaches were preventable with MFA or passkeys. Stolen and compromised credentials were the leading attack vector in attacks against publicly traded companies, where 133 cyberattacks resulted in breach notifications. Over 2.8 billion passwords — hashed or otherwise — were posted for sale in criminal forums in 2024 alone (Verizon DBIR 2025), ensuring attackers have a virtually unlimited supply of credential material to work with.
Vulnerability Exploitation: The Patch Problem. Exploitation of vulnerabilities as an initial access vector nearly tripled year-over-year in Verizon’s 2024 DBIR dataset, driven heavily by edge device vulnerabilities in VPNs, firewalls, and remote access tools. In espionage-motivated breaches specifically, vulnerability exploitation reaches 70% as an initial access vector. Only 54% of vulnerable devices were fully remediated within a year, with a median remediation time of 32 days for known vulnerabilities.
Third-Party Compromise: The Supply Chain Problem. The doubling of third-party involvement — from 15% to 30% of all breaches between the 2024 and 2025 DBIR datasets — is the most significant structural shift in current breach data. Supply chain attacks directly impacted 134 organizations in 2024 and indirectly reached 657 entities, generating 203 million victim notices. In 2025, that figure grew further: 79 supply chain attacks affected 690 organizations and 78.3 million individuals in H1 2025 alone (ITRC / Help Net Security).
Source: ITRC 2024 Annual Data Breach Report | Verizon 2025 DBIR via Help Net Security
Close Credential and Vulnerability Gaps with CNiC Managed IT →
Data Breaches by Industry: Which Sectors Are Hit Hardest
Breach frequency and breach cost don’t always move in the same direction across industries. The sector with the most breaches is not always the one paying the highest price per incident. Understanding both dimensions — volume and impact — is essential for organizations benchmarking their own risk exposure.
| Industry | U.S. Breaches (2024) | YoY Change | Avg Breach Cost | Source |
|---|---|---|---|---|
| Financial Services | 737 (#1) | +67% | $6.08M | ITRC / IBM 2025 |
| Healthcare | 536 (#2) | −37% (from 2023 peak) | $7.42M (highest) | ITRC / IBM 2025 |
| Professional Services | 478 (#3, 2025 H1) | Significant growth | $4.46M (supply chain avg) | ITRC 2025 |
| Manufacturing | High volume | Rising (espionage-driven) | $5.00M | IBM / Verizon 2025 |
| Technology | Significant | Stable | $4.97M | IBM 2025 |
| Government / Public Sector | Significant | Stable | $2.70M (lower cost, high volume) | IBM 2025 |
Financial Services: The New #1 Target. For the first time since 2018, financial services surpassed healthcare as the most breached U.S. industry in 2024. The 737 compromises — a 67% year-over-year surge — were driven primarily by attacks on commercial banks and insurance firms. The shift doesn’t necessarily reflect improved healthcare security; ITRC analysis suggests it may reflect a calculated reallocation by attackers toward financial institutions whose data carries higher immediate monetization value. Financial data enables fraud, identity theft, and account takeover at scale in ways medical records alone do not.
Healthcare: Still the Most Expensive. Despite dropping to second in breach count, healthcare retains its 15-year streak as the most expensive industry for data breaches, averaging $7.42 million per incident in 2025 (IBM). The Change Healthcare breach alone generated approximately 190 million victim notices and cost UnitedHealth Group an estimated $2.4 billion in total. Five of the top 10 U.S. breaches of 2024 were healthcare incidents, and the sector faces the compound challenge of legacy systems, high data value, and strong attacker motivation.
Manufacturing: The Espionage Shift. Verizon’s 2025 DBIR identified a significant rise in espionage-motivated attacks specifically targeting manufacturing — a departure from the historically financially-motivated profile. Nation-state actors targeting industrial intellectual property, production systems, and supply chain positioning are increasingly present in manufacturing breach data, contributing to a $5.00 million average breach cost and making this sector one of the most rapidly evolving threat environments.
Source: ITRC 2024 Annual Data Breach Report | IBM Cost of a Data Breach Report 2025
Find Industry-Specific Breach Protection from CNiC →
How Long Breaches Go Undetected: Detection and Containment Timelines
Time is the most critical variable in data breach economics. The longer an attacker maintains access, the more data they can exfiltrate, the more systems they can compromise, and the more expensive the eventual remediation becomes. IBM’s research quantifies the cost of time with precision: every day of undetected attacker access adds to the final bill.
Average Breach Lifecycle by Initial Access Vector (IBM 2025)
The 241-day average breach lifecycle in 2025 represents meaningful progress from prior years — and a direct result of AI and automation deployment in security operations. IBM’s research found that organizations with AI and automation tools in their security stack contain breaches an average of 108 days faster than those without. The financial implication is significant: those organizations also save an average of $1.9 million per breach compared to organizations without AI-driven defense.
Breaches involving stolen credentials are the hardest to detect quickly — averaging 292 days from initial access to full containment. This is because credential-based attacks are inherently difficult to distinguish from legitimate user activity, particularly if the stolen credentials belong to privileged accounts or if attackers operate during normal business hours in the victim’s time zone. Mandiant’s M-Trends 2025 report found a median dwell time of approximately 10 days for targeted intrusions when incident response was engaged — but that assumes the organization knew to call for help, which requires detecting the intrusion in the first place.
IBM’s data shows breaches contained under 200 days cost $3.87 million on average, versus $5.01 million for those exceeding 200 days. Stolen credential breaches average 292 days — placing them firmly in the high-cost category. Applying the cost differential: a credential-based breach costs an estimated $1.14 million more than the same breach contained in under 200 days. Combined with the $1.9 million AI/automation savings IBM identified, an organization that deploys AI-assisted detection AND eliminates credential vulnerabilities through MFA could reduce expected breach costs by approximately $3.04 million per incident versus an unprotected baseline — a figure that dwarfs the annual cost of those security investments for virtually any organization.
CNiC-derived calculation: IBM cost differential ($5.01M − $3.87M = $1.14M) + IBM AI savings ($1.9M) = $3.04M combined savings estimate. Sources: IBM Cost of a Data Breach Report 2025. Interpretation and combination original to CNiC Solutions.
Source: IBM Cost of a Data Breach Report 2025
Deploy AI-Enhanced Detection to Cut Breach Dwell Time →
Supply Chain and Third-Party Breach Statistics: The Fastest-Growing Threat Vector
The structural shift that most defines the current data breach landscape is the explosion of third-party and supply chain compromise. When a single vendor, software provider, or managed service provider is breached, every organization that depends on them becomes a potential victim — often without any failure of their own security controls.
The doubling of third-party involvement in Verizon’s DBIR — from 15% to 30% of all breaches — is one of the most significant single-year shifts in the report’s history. The ITRC’s complementary data shows this isn’t just a percentage shift: each supply chain attack now reaches significantly more downstream victims. In 2025, 79 supply chain attacks affected 690 organizations — nearly 9 downstream victims per attack, up dramatically from prior periods. The Change Healthcare ransomware attack exemplifies this cascade: one breach of a healthcare payment processor disrupted billing, prescriptions, and patient care across hundreds of hospital systems, medical practices, and pharmacies nationwide.
Supply Chain Breach Downstream Impact (ITRC)
The supply chain risk is compounded by remediation failures. Only 54% of vulnerable devices across organizations were fully remediated within a year of a known vulnerability being disclosed, with a median remediation time of 32 days for known CVEs. This gap between discovery and patching — particularly for edge devices, VPNs, and firewalls that form the perimeter — creates persistent windows of exposure that supply chain attackers specifically target.
For managed service providers (MSPs) and their clients — the exact profile of CNiC Solutions and the Houston businesses it serves — supply chain risk cuts both directions. An MSP with access to dozens or hundreds of client environments becomes a high-value target precisely because breaching it provides cascading access. This is why Verizon’s DBIR explicitly calls out managed service provider compromise as a key escalation vector and why MSP security posture has become a direct concern for the businesses they serve.
Source: Verizon 2025 Data Breach Investigations Report | ITRC 2024 Annual Data Breach Report
Protect Against Third-Party Breach Exposure with CNiC →
Nation-State Actors and Espionage: The New Dimension of Data Breaches
Data breaches have historically been dominated by financially motivated external actors — organized criminal groups seeking data to monetize through fraud, ransomware, or sale on dark web markets. The 2025 DBIR data shows this profile is changing, with espionage-motivated breaches surging dramatically and nation-state actors increasingly blurring the line between intelligence operations and financial crime.
The 163% year-over-year surge in espionage-motivated breaches represents one of the most significant findings in recent DBIR history. Advanced Persistent Threat (APT) groups — typically nation-state sponsored — are increasingly executing what security researchers call “double-dipping”: using the same network access for both strategic intelligence collection and financial exploitation through ransomware or data extortion. This blending of motivations makes attribution and response more complex, as defenders must account for both data theft and operational disruption as simultaneous objectives.
Manufacturing is particularly exposed to this trend. Verizon’s 2025 DBIR specifically calls out a “significant rise in espionage-motivated attacks in the Manufacturing sector,” targeting industrial intellectual property, production data, and supply chain positioning. Nation-state actors from China, Russia, Iran, and North Korea have all been publicly attributed to manufacturing sector intrusions targeting defense contractors, semiconductor manufacturers, pharmaceutical companies, and critical infrastructure operators.
For Texas businesses — particularly those in the Houston energy corridor, aerospace, and defense manufacturing sectors — the espionage dimension of data breach risk is directly relevant. CISA has repeatedly identified Texas critical infrastructure, including energy production and petrochemical facilities, as targets of nation-state reconnaissance and intrusion activity.
Source: Verizon 2025 DBIR Analysis | Help Net Security DBIR Coverage
Get a Texas-Focused Threat Assessment from CNiC’s vCIO Team →
Data Breach Statistics Summary (2026 Reference Table)
| Statistic | Data Point | Source | Year |
|---|---|---|---|
| U.S. data compromises | 3,158 (−1% from 2023 record) | ITRC 2024 Annual Report | 2024 |
| U.S. victim notices issued | 1.73 billion (+312%) | ITRC 2024 Annual Report | 2024 |
| Victim notices from 6 mega-breaches | ~1.47B (85% of total) | ITRC 2024 Annual Report | 2024 |
| Global confirmed breaches (Verizon) | 12,195 from 22,052 incidents | Verizon DBIR 2025 | 2025 |
| Countries represented in DBIR | 139 | Verizon DBIR 2025 | 2025 |
| Ransomware in breaches | 44% (up from 32%) | Verizon DBIR 2025 | 2025 |
| Third-party involvement | 30% of breaches (doubled from 15%) | Verizon DBIR 2025 | 2025 |
| Human element in breaches | 60% | Verizon DBIR 2025 | 2025 |
| Most breached U.S. industry (2024) | Financial Services: 737 breaches (+67%) | ITRC 2024 Annual Report | 2024 |
| 2nd most breached U.S. industry | Healthcare: 536 breaches | ITRC 2024 Annual Report | 2024 |
| Most expensive breach industry | Healthcare: $7.42M avg (15th consecutive year) | IBM Cost of Breach 2025 | 2025 |
| Financial services avg breach cost | $6.08M | IBM Cost of Breach 2025 | 2025 |
| Manufacturing avg breach cost | $5.00M | IBM Cost of Breach 2025 | 2025 |
| Primary initial access: credential abuse | 22% of breaches | Verizon DBIR 2025 | 2025 |
| Primary initial access: vuln exploitation | 20% of breaches | Verizon DBIR 2025 | 2025 |
| Primary initial access: phishing | 16% of breaches | IBM 2025 / Verizon DBIR 2025 | 2025 |
| Average breach lifecycle (global) | 241 days (lowest in decade) | IBM Cost of Breach 2025 | 2025 |
| Stolen credential breach lifecycle | 292 days (longest of any vector) | IBM Cost of Breach 2025 | 2025 |
| AI/automation: breach timeline savings | 108 days faster detection/containment | IBM Cost of Breach 2025 | 2025 |
| Cost of breach <200 days vs >200 days | $1.14M cost difference | IBM Cost of Breach 2025 | 2025 |
| Supply chain: 2024 entities indirectly affected | 657 from 134 directly attacked | ITRC 2024 Annual Report | 2024 |
| Supply chain: 2025 entities affected | 1,251 (nearly 2× 2024) | ITRC 2025 | 2025 |
| Supply chain avg breach cost | $4.46M avg; 26 days longer detection | IBM 2025 | 2025 |
| Espionage-motivated breaches | 17% of all breaches (+163% YoY) | Verizon DBIR 2025 | 2025 |
| Breaches with no attack vector disclosed | 74% of U.S. notices | ITRC 2024 Annual Report | 2024 |
| Mega-breaches preventable with MFA | 4 of 6 largest 2024 breaches | ITRC 2024 Annual Report | 2024 |
| Vulnerable devices remediated within 1 year | Only 54% | Verizon DBIR 2025 | 2025 |
| Median CVE remediation time | 32 days for known vulnerabilities | Verizon DBIR 2025 | 2025 |
| AI/automation savings per breach | $1.9M avg | IBM Cost of Breach 2025 | 2025 |
| IR plan ROI: cost reduction | 61% cost reduction; $2.66M saved | IBM Cost of Breach 2025 | 2025 |
Frequently Asked Questions: Data Breach Statistics
Methodology & Sources
All statistics in this article are sourced directly from Tier 1 primary sources. No blog-to-blog citations were used as primary references. This article focuses on breach frequency, causes, industries, and detection timelines. For breach cost data, see our companion article: Average Cost of a Data Breach Statistics 2026. CNiC-derived calculations are labeled with formulas and source attribution.
Primary Sources Referenced:
- ITRC 2024 Annual Data Breach Report — Identity Theft Resource Center’s 19th annual tracking of all publicly reported U.S. data compromises. idtheftcenter.org
- Verizon 2025 Data Breach Investigations Report (DBIR) — 18th annual analysis of 22,052 security incidents and 12,195 confirmed breaches across 139 countries. verizon.com/dbir
- IBM Cost of a Data Breach Report 2025 — Quantitative research on breach costs, detection timelines, initial vectors, and AI/automation impact. ibm.com
- Mandiant M-Trends 2025 — Incident response-based analysis of initial access vectors and dwell times from active breach investigations.
- ITRC H1 2025 Data Breach Report — Mid-year tracking of 2025 U.S. compromises, supply chain impacts, and industry distribution.
- FBI IC3 2024 Annual Report — U.S. cybercrime complaint and loss data providing breach-enablement context. ic3.gov
- Help Net Security / Keepnet Analysis of Verizon 2025 DBIR — Supporting analysis and sector-specific data extraction.
This article was researched and published by CNiC Solutions, a Houston-based managed IT and cybersecurity provider. Content is updated as new primary source data becomes available. Last updated: May 2026.

related posts
What Is DRaaS (Disaster Recovery as a Service)?
June 25, 2026DRaaS (Disaster Recovery as a Service) is a cloud-based model in which a third-party provider replicates…
What Is a Virtual CIO and Why You Need One
June 25, 2026A Virtual CIO (vCIO) is an outsourced technology executive who provides the same strategic IT leadership…
What Are Bots? Good Bots, Bad Bots, and How to Defend Against…
June 25, 2026A bot is an automated software program that carries out predefined tasks without human intervention, working…
IT Compliance Checklist for Small Business
June 25, 2026An IT compliance checklist turns a wall of regulations into a set of specific, assignable tasks…