

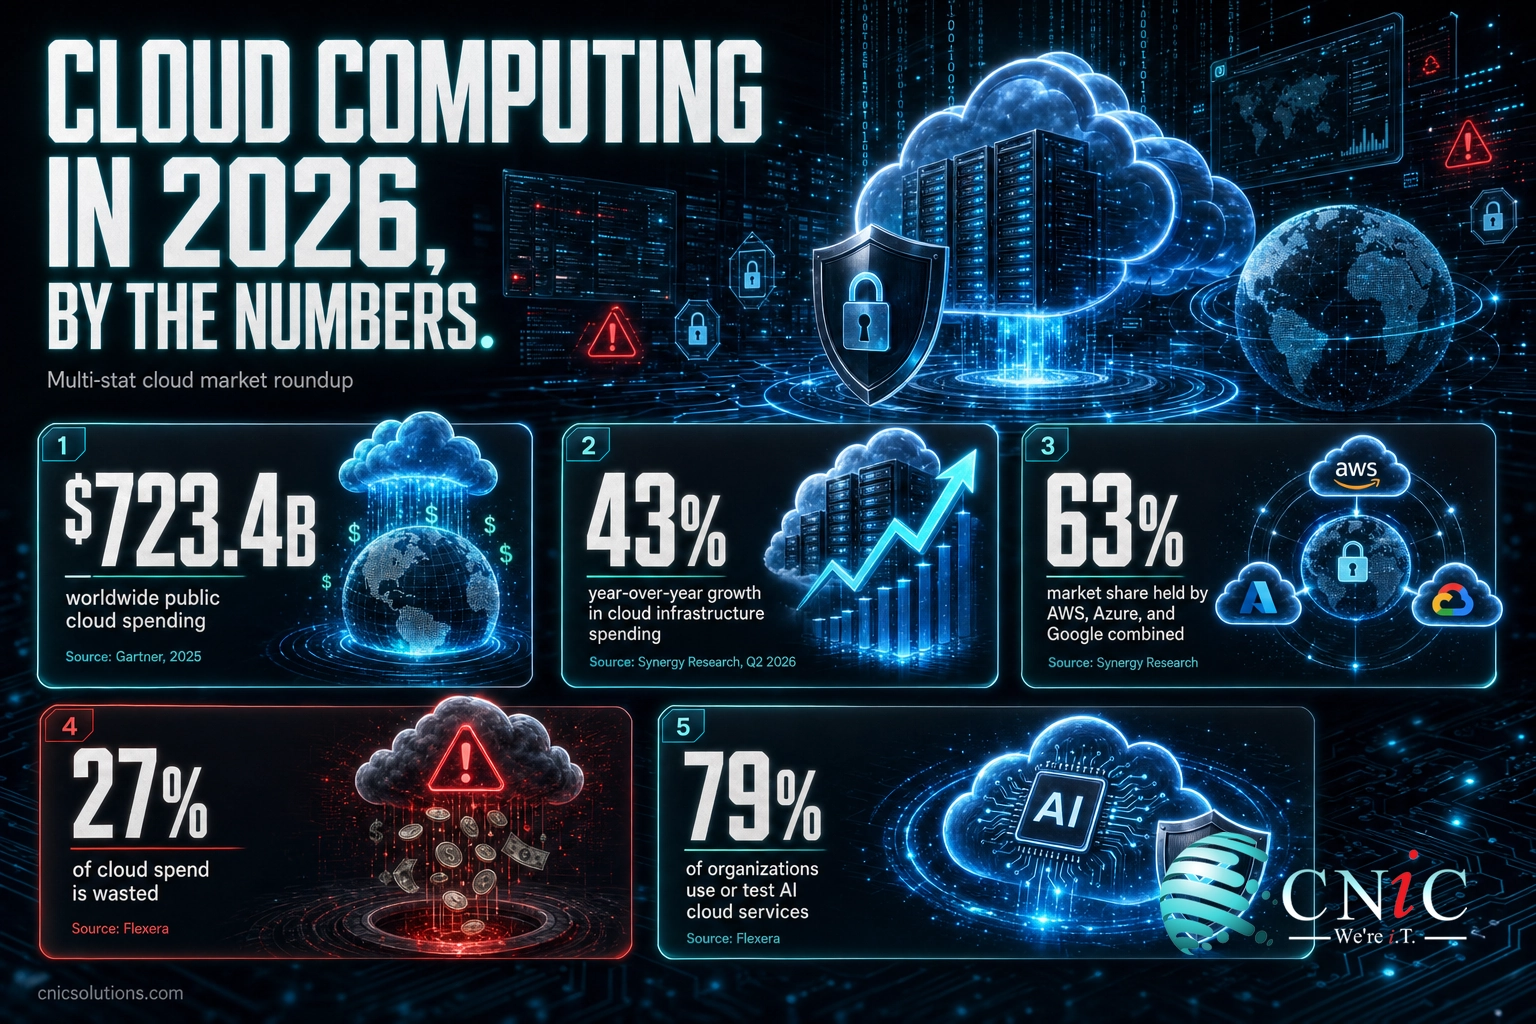
Worldwide spending on public cloud services is on track to reach $723.4 billion in 2025 and roughly $850 billion in 2026, according to Gartner, yet the most revealing cloud statistic of the year is a warning: organizations estimate that 27% of their cloud spend is wasted. Cloud computing is now both the default way businesses run software and one of the hardest line items to keep under control.
- The market is enormous and still accelerating. Gartner projects $723.4 billion in public cloud spending for 2025 (up 21.5%) and about $850 billion for 2026.
- Growth is speeding up, not slowing. Cloud infrastructure spending hit $143.4 billion in Q2 2026 alone, up 43% year over year, the fastest pace in eight years (Synergy Research).
- Adoption has crossed the tipping point. More than half of enterprise and SMB workloads now run in public clouds, and 70% of organizations use a hybrid strategy (Flexera).
- Three vendors dominate. AWS (28%), Microsoft Azure (20%), and Google Cloud (15%) hold 63% of the infrastructure market (Synergy, Q2 2026).
- AI is now the growth engine. Generative AI has driven at least half of cloud market growth since ChatGPT, and GenAI-specific services grew 165% year over year (Synergy).
- Waste is the persistent problem. 27% of cloud spend is wasted, 84% call cost their top challenge, and budgets overrun by 17% on average (Flexera).
- Management is the differentiator. 59% of organizations now run a FinOps team and 60% use a managed provider to keep cloud spend and complexity in check (Flexera).
What’s in This Guide
- How Big the Cloud Market Is in 2026
- Cloud Adoption: How Far Businesses Have Moved
- Where the Money Goes: SaaS, IaaS, and PaaS
- The Big Three: Cloud Market Share in 2026
- AI Is Now the Engine of Cloud Growth
- The Cost Problem: Waste, Overspend, and FinOps
- Cloud Computing Statistics Summary Table
- Frequently Asked Questions
- Methodology and Sources
How Big the Cloud Market Is in 2026
The headline number depends on what you count. Gartner measures total end-user spending on public cloud services, which includes software delivered as a service, and forecasts $723.4 billion for 2025, up 21.5% from $595.7 billion in 2024. It expects that figure to approach $850 billion in 2026. Synergy Research Group tracks a narrower slice, the infrastructure that providers actually sell, and put full-year 2024 cloud infrastructure services spending at $330.4 billion. Both measures point the same way: up, and faster than almost anyone predicted.
Source: Gartner public cloud services forecast.
CNiC Solutions Analysis: What $723 billion a year actually looks like. Taking Gartner’s 2025 forecast of $723.4 billion and spreading it evenly, businesses worldwide spend roughly $1.98 billion on public cloud every day, or about $22,900 every second. Formula: $723.4 billion / 365 days = $1.98 billion per day; $1.98 billion / 86,400 seconds = about $22,900 per second. Calculation and interpretation original to CNiC Solutions, derived from Gartner spending data.
For a small or midsize business, these trillion-dollar figures matter less as trivia than as context. Cloud pricing, feature releases, and vendor roadmaps are all shaped by a market growing more than 20% a year. The practical result is that the tools your competitors use get cheaper and more capable on a schedule you do not control, which is a large part of why moving core systems to a managed cloud environment has shifted from optional to expected.
Source: Gartner Public Cloud Forecast | Synergy Research Group
Cloud Adoption: How Far Businesses Have Moved
Adoption is no longer the story. Nearly every organization uses the cloud in some form; the interesting question is how much of the business now runs there. Flexera’s 2025 State of the Cloud Report found that more than half of enterprise and SMB workloads have moved to public cloud, and that 70% of organizations run a hybrid model with data and applications spread across at least one public and one private cloud. On average, companies now juggle 2.4 public cloud providers at once.
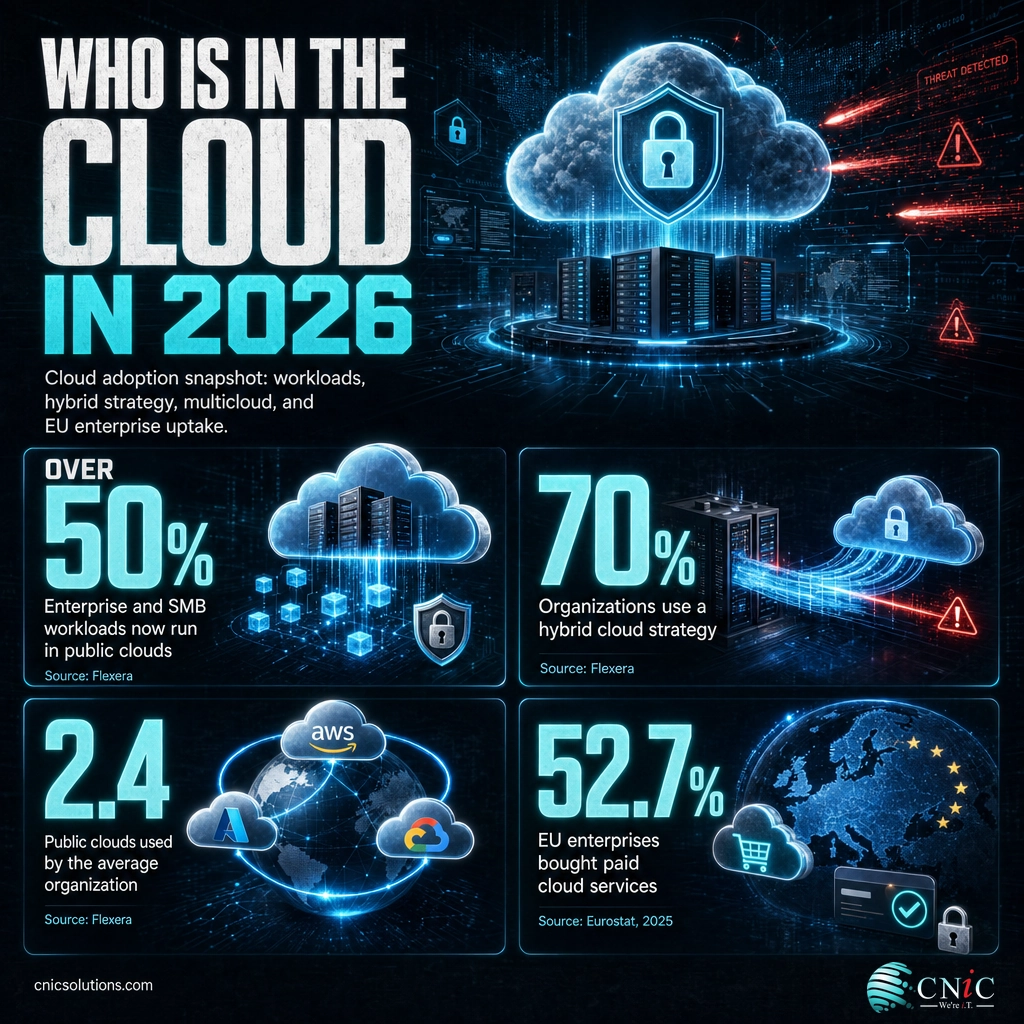
| Adoption Metric | Figure | Source |
|---|---|---|
| EU enterprises using paid cloud services (2025) | 52.7% | Eurostat |
| Organizations using a hybrid strategy | 70% | Flexera |
| Average public clouds per organization | 2.4 | Flexera |
| Public cloud share of enterprise IT spend | 45% | Gartner |
| Cloud workloads repatriated to on-premises | 21% | Flexera |
What about “cloud repatriation”? The idea that companies are pulling back from the cloud gets more headlines than the data supports. Flexera found that only 21% of cloud workloads have been moved back on-premises, and that new and migrating workloads continue to outpace those exits, so net cloud usage keeps rising. Importantly, 60% of organizations now rely on a managed services provider to handle cloud operations, a sign that the challenge has shifted from whether to adopt the cloud to how to run it well.
The adoption gap between large enterprises and smaller firms is closing quickly, and that has real consequences for competitiveness. When most of your peers already run email, files, accounting, and line-of-business apps in the cloud, staying on aging on-premises servers becomes a disadvantage in cost, security, and hiring. For many owners the smartest move is not a do-it-yourself migration but handing day-to-day IT operations to a managed provider that already runs cloud environments at scale. Businesses weighing that step often start by reviewing where they stand against broader trends in small-business cyber risk and readiness.
Source: Eurostat Cloud Computing Statistics | Flexera 2025 State of the Cloud Report
Where the Money Goes: SaaS, IaaS, and PaaS
Public cloud spending splits into three main layers, and knowing the mix helps explain where budgets actually flow. Software as a service (SaaS), the finished applications businesses log into, remains by far the largest category. Infrastructure as a service (IaaS), the raw compute and storage, and platform as a service (PaaS), the middle layer developers build on, are close behind each other and growing fastest as AI workloads pile on. Gartner’s 2025 segment figures show SaaS well ahead, with IaaS and PaaS nearly tied.
Source: Gartner public cloud services forecast, 2025.
The reason IaaS and PaaS are catching up to SaaS is that AI runs on them. Training and serving models consumes raw compute (IaaS) and managed AI platforms (PaaS), so every wave of new AI features shows up first as growth in those two layers. For a typical business, though, most direct cloud spending still lands in SaaS: the subscriptions for productivity suites, accounting, CRM, and industry apps that quietly add up across departments. Getting a clear inventory of those subscriptions, and consolidating the redundant ones, is often the fastest win a structured approach to managing cloud and IT infrastructure delivers.
Source: Gartner Public Cloud Services Forecast
The Big Three: Cloud Market Share in 2026
The infrastructure market is one of the most concentrated in technology. Synergy Research Group’s Q2 2026 data shows Amazon Web Services holding 28% of worldwide cloud infrastructure spending, Microsoft Azure at 20%, and Google Cloud at 15%. Together those three account for 63% of a market that reached $143.4 billion in the quarter. Everyone else, from Oracle and IBM to specialist AI providers, shares the remaining 37%.
Source: Synergy Research Group, Q2 2026. The three together hold 63% of the market.
Where the growth is hottest. Synergy notes that the tier-two providers growing fastest, including Oracle, CoreWeave, Snowflake, Cloudflare, and Databricks, are riding AI and GPU-as-a-service demand, with CoreWeave breaking into the top twenty for the first time. For a business, the takeaway is not to chase the fastest-growing vendor but to recognize that the platform decision now shapes cost, integration, and security for years. That choice is easier to make well with independent guidance than under a single vendor’s sales pressure, which is one reason many firms lean on a broader view of the 2026 threat and technology landscape before committing.
Market concentration cuts both ways for smaller businesses. On one hand, the Big Three offer maturity, reliability, and a deep ecosystem of tools. On the other, spreading workloads across 2.4 providers on average introduces real complexity in billing, security, and skills. That is the gap a managed provider fills: matching each workload to the right platform, then running all of them under one operational and security standard rather than three disconnected consoles.
Source: Synergy Research Group, Q2 2026 Cloud Market
AI Is Now the Engine of Cloud Growth
If one force explains why cloud spending reaccelerated in 2025 and 2026, it is artificial intelligence. Synergy Research Group estimates that generative AI has been responsible for at least half of all cloud market growth since ChatGPT launched, and that GenAI-specific cloud services grew 165% year over year in Q2 2026. The broader public IaaS and PaaS layers that host AI workloads grew 47% in the same quarter. On the demand side, Flexera found 79% of organizations already using or experimenting with AI and machine-learning cloud services.

Source: Synergy Research Group, Q2 2026.
For a small or midsize business, the AI cloud boom is a double-edged opportunity. The same platforms that power billion-dollar models now offer packaged AI features, document search, customer-service assistants, transcription, forecasting, that a ten-person company can turn on for a monthly fee. The risk is that AI services are metered by usage, so costs can climb quietly as adoption spreads across a team. Rolling out AI on a controlled, monitored footprint, rather than letting each department sign up on its own card, is exactly the kind of guardrail AI-enhanced IT support is built to provide.
Source: Synergy Research Group, Q2 2026 Cloud Market | Flexera 2025 State of the Cloud Report

The Cost Problem: Waste, Overspend, and FinOps
For all the growth, the defining cloud statistic of 2026 may be a failure metric. Flexera’s 2025 State of the Cloud Report found that organizations estimate 27% of their cloud spend is wasted, a number that has not budged in three years. That waste is why 84% of respondents name managing cloud cost as their single biggest challenge, ahead of security, and why organizations overshoot their cloud budgets by an average of 17%. Cloud spending is expected to rise another 28% in the coming year, so the cost of poor management compounds.
| Cloud Cost Metric | Figure | Source |
|---|---|---|
| Cloud spend estimated as wasted | 27% | Flexera |
| Say managing cloud cost is their top challenge | 84% | Flexera |
| Average overrun beyond cloud budget | 17% | Flexera |
| Expected increase in cloud spend next year | 28% | Flexera |
| Organizations with a dedicated FinOps team | 59% | Flexera |
| Organizations using a managed provider for cloud | 60% | Flexera |
CNiC Solutions Analysis: The dollar size of cloud waste. Combining Flexera’s finding that 27% of cloud spend is wasted with Gartner’s forecast of $723.4 billion in 2025 public cloud spending implies roughly $195 billion of wasted cloud spend in a single year. Formula: $723.4 billion x 27% = about $195 billion. Even applied only to the narrower cloud infrastructure market Synergy measured for 2024 ($330.4 billion), the waste would top $89 billion. Calculation and interpretation original to CNiC Solutions, derived from Flexera and Gartner data.
Myth: “Moving to the cloud automatically saves money.” The data says otherwise. With 27% of spend wasted, budgets overrun by 17%, and cost ranked the top challenge by 84% of organizations, the cloud saves money only when it is actively managed. Idle instances, oversized resources, forgotten test environments, and duplicate SaaS subscriptions quietly inflate the bill. The savings come from governance, right-sizing, and monitoring, not from the migration itself.
The encouraging part of the cost data is that the fix is known. Organizations are responding by standing up FinOps teams (59%, up from 51%) and, more commonly for smaller firms, by outsourcing cloud operations to a provider that does this every day (60%). A managed partner brings the tooling to spot idle resources, the discipline to right-size before renewal, and a single point of accountability for a bill spread across 2.4 providers. For most small and midsize businesses, that is a faster and cheaper path to controlling cloud spend than hiring a specialist team in-house. Reliable, well-managed cloud also depends on the workloads being backed up and recoverable, which is why cost discipline and strategic IT leadership through a Virtual CIO tend to go together.
Source: Flexera 2025 State of the Cloud Report
Cloud Computing Statistics Summary Table
Every headline figure from this article in one place for quick reference and citation. All statistics trace to the Tier 1 primary sources listed in the methodology below.
| Statistic | Figure | Source | Year |
|---|---|---|---|
| Worldwide public cloud end-user spending | $723.4 billion | Gartner | 2025 |
| Public cloud spending, prior year | $595.7 billion | Gartner | 2024 |
| Public cloud spending forecast | ~$850 billion | Gartner | 2026 |
| Year-over-year public cloud growth | 21.5% | Gartner | 2025 |
| SaaS (cloud application) spending | $299.1 billion | Gartner | 2025 |
| IaaS (cloud infrastructure) spending | $211.9 billion | Gartner | 2025 |
| PaaS (cloud platform) spending | $208.6 billion | Gartner | 2025 |
| Public cloud share of enterprise IT spend | 45% | Gartner | 2026 |
| Full-year cloud infrastructure spending | $330.4 billion | Synergy Research | 2024 |
| Cloud infrastructure spending, single quarter | $143.4 billion | Synergy Research | Q2 2026 |
| Quarterly cloud infrastructure growth | 43% | Synergy Research | Q2 2026 |
| AWS cloud infrastructure market share | 28% | Synergy Research | Q2 2026 |
| Microsoft Azure market share | 20% | Synergy Research | Q2 2026 |
| Google Cloud market share | 15% | Synergy Research | Q2 2026 |
| Big Three combined market share | 63% | Synergy Research | Q2 2026 |
| GenAI-specific cloud services growth | +165% | Synergy Research | Q2 2026 |
| GenAI share of cloud market growth | ~50% | Synergy Research | 2023-2024 |
| Organizations using or testing AI/ML cloud services | 79% | Flexera | 2025 |
| EU enterprises using paid cloud services | 52.7% | Eurostat | 2025 |
| Organizations using a hybrid cloud strategy | 70% | Flexera | 2025 |
| Average public clouds per organization | 2.4 | Flexera | 2025 |
| Cloud workloads repatriated on-premises | 21% | Flexera | 2025 |
| Cloud spend estimated as wasted | 27% | Flexera | 2025 |
| Organizations naming cost their top challenge | 84% | Flexera | 2025 |
| Average cloud budget overrun | 17% | Flexera | 2025 |
| Organizations with a dedicated FinOps team | 59% | Flexera | 2025 |
| Organizations using a managed provider for cloud | 60% | Flexera | 2025 |
Frequently Asked Questions
How big is the cloud computing market in 2026?
What percentage of businesses use cloud computing?
Which company has the largest cloud market share in 2026?
How much cloud spending is wasted?
How is AI affecting cloud growth in 2026?
Methodology and Sources
How we compiled these statistics
Every figure in this article is drawn from a Tier 1 primary source: a major analyst firm’s published forecast, an independent market-research group’s telemetry, or an official government statistics body. We do not cite blog-to-blog statistics or unverified aggregations. Where a figure is derived, it is labeled as a CNiC Solutions analysis with its formula and inputs shown. Gartner and Synergy Research Group measure different things (Gartner tracks total public cloud end-user spending including software; Synergy tracks cloud infrastructure services), and each is labeled accordingly rather than blended. Figures reflect the most recent reporting available at the time of writing in 2026; each source’s reporting period is noted in the summary table.
Primary sources:
For journalists and researchers: You are welcome to cite the statistics and the CNiC Solutions analysis in this article with attribution and a link to this page. For the original figures, please attribute the underlying primary source named beside each statistic in the summary table.



related posts
McAfee Scam Emails: How to Spot Fake Renewal Notices
September 20, 2026A fake McAfee renewal email is one of the most common scams landing in business inboxes…
Microsoft 365 Business Premium vs Office 365 E3: Which Is Right for…
September 20, 2026Here is the short answer most buyers do not expect: Microsoft 365 Business Premium costs less…
Malware Statistics for 2026: Volume, Variants, and the Shift to Malware-Free Attacks
September 19, 2026Security vendors now track more than 1.5 billion known malware samples, and the AV-TEST Institute registers…
Managed Services Statistics: Market Size, Growth, and Adoption Data
September 19, 2026The global managed services market is on track to pass $430 billion in 2026, and by…