

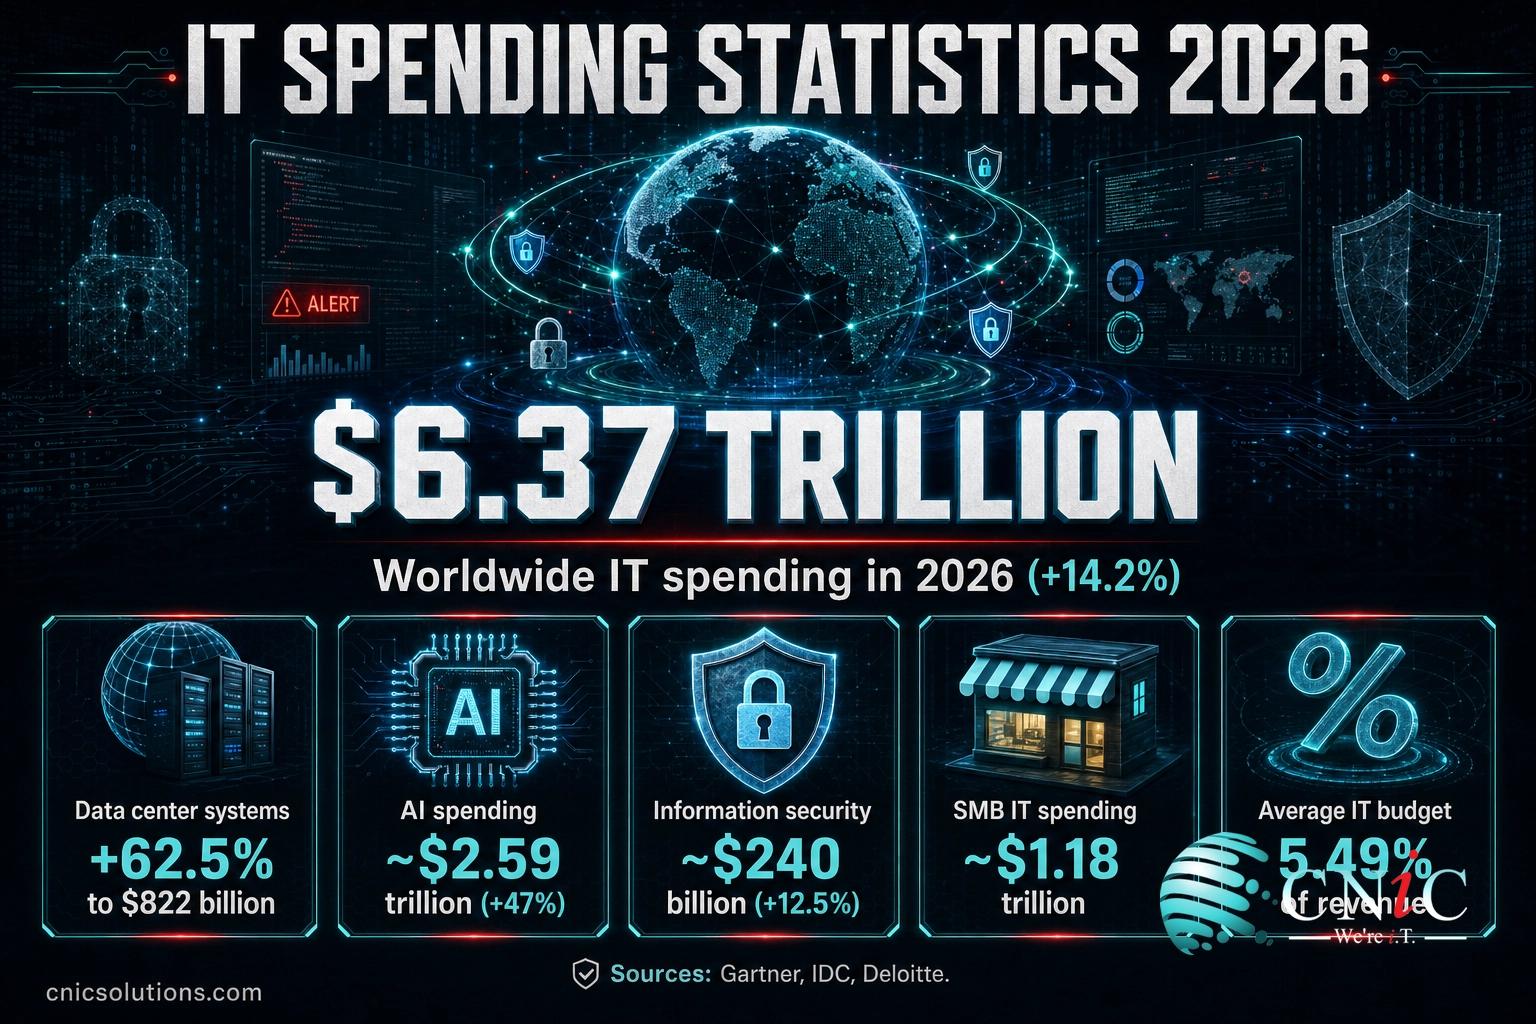
Worldwide IT spending is on track to reach $6.37 trillion in 2026, a 14.2% jump and the first full year above $6 trillion, according to Gartner. Almost all of that acceleration is concentrated in one place: the data center and AI infrastructure buildout. For most businesses the real question is not how big the global number is, but how much of their own revenue they should be putting into technology, and where.
- Record total: worldwide IT spending is forecast at $6.37 trillion in 2026, up 14.2% year over year (Gartner, July 2026).
- Data center is the outlier: data center systems spending is set to grow 62.5% to $822 billion, by far the fastest segment, while every other segment grows in the single digits to mid-teens (Gartner).
- AI is the engine: worldwide AI spending is forecast at roughly $2.59 trillion in 2026, a 47% increase, with AI infrastructure over 45% of it (Gartner).
- Security keeps climbing: end-user information security spending is expected to rise about 12.5% to near $240 billion, with cloud security the fastest subsegment at 28.8% (Gartner).
- SMBs are a $1 trillion-plus market: IDC estimates small and midsize business IT spending near $1.18 trillion in 2026, shifting from hardware toward subscription services (IDC, Techaisle).
- The benchmark: the average technology budget is about 5.49% of revenue, ranging from under 2% in construction and manufacturing to roughly 8% in banking (Deloitte, Avasant Computer Economics).
What’s in This Report
- Worldwide IT Spending Hits $6.37 Trillion
- Where the Money Goes: IT Spending by Segment
- AI Is the Engine Behind the Numbers
- Cybersecurity: The Line Item Nobody Cuts
- What Small and Midsize Businesses Actually Spend
- How Much Should You Spend? IT Budget Benchmarks
- Summary Table: Every Stat at a Glance
- Frequently Asked Questions
- Methodology and Sources
1Worldwide IT Spending Hits $6.37 Trillion
The headline number keeps setting records. Gartner’s July 2026 forecast puts worldwide IT spending at $6.37 trillion for the year, a 14.2% increase over 2025. That is the first full year technology spending has sat above the $6 trillion line, and it caps a run of upward revisions: Gartner’s own estimate for 2026 climbed from $6.08 trillion in October 2025, to $6.15 trillion in February, to $6.31 trillion in April, and finally to $6.37 trillion by midyear as the scale of AI investment became clearer.
Worldwide IT Spending by Year (US$ Trillions)
2026 total is Gartner’s July 2026 forecast ($6.37T, +14.2%). Prior-year totals are Gartner forecasts, rounded; 2025 is implied by the 14.2% growth figure. Source: Gartner.
It is easy to look at a $6.37 trillion global figure and conclude that IT budgets are exploding everywhere. They are not. This total is inflated by a small number of very large buyers, hyperscalers and cloud providers pouring capital into AI data centers, and by currency effects. The spending patterns of a typical small or midsize business look very different, which is why the segment and benchmark data later in this report matter more for budgeting than the headline.
The macro number is a poor budgeting tool. Gartner’s worldwide forecast tells you the direction of the market, not what your business should spend. A 14.2% global increase driven by AI data centers does not mean your IT budget should grow 14.2%. Use the per-revenue benchmarks in the budgeting section, adjusted for your industry and how much your operations depend on technology, to set a realistic target.
Source: Gartner Worldwide IT Spending Forecast, July 2026
Setting that realistic target, and defending it to ownership, is exactly the kind of planning a fractional technology leader handles for growing businesses.
Get a Virtual CIO Budget Assessment
2Where the Money Goes: IT Spending by Segment
Gartner divides IT spending into five segments, and in 2026 they are moving at wildly different speeds. Data center systems are the standout, forecast to grow 62.5% to $822 billion as providers race to build AI capacity. Software follows at 15.5% growth to $1.47 trillion, while the two largest segments by dollar value, IT services ($1.57 trillion) and communications services ($1.35 trillion), grow at a modest 5.3% and 4.4%. Devices land in the middle at 9.8% growth to $868 billion.
| Segment | 2026 Spending | Growth | Source |
|---|---|---|---|
| IT services | $1.57 trillion | +5.3% | Gartner 2026 |
| Software | $1.47 trillion | +15.5% | Gartner 2026 |
| Communications services | $1.35 trillion | +4.4% | Gartner 2026 |
| Devices | $868 billion | +9.8% | Gartner 2026 |
| Data center systems | $822 billion | +62.5% | Gartner 2026 |
| Infrastructure as a service (within above) | $287 billion | +29.3% | Gartner 2026 |
| Total worldwide IT spending | $6.37 trillion | +14.2% | Gartner 2026 |
The chart below shows the growth rates side by side, and the story is impossible to miss: one segment is running at more than four times the pace of the rest.
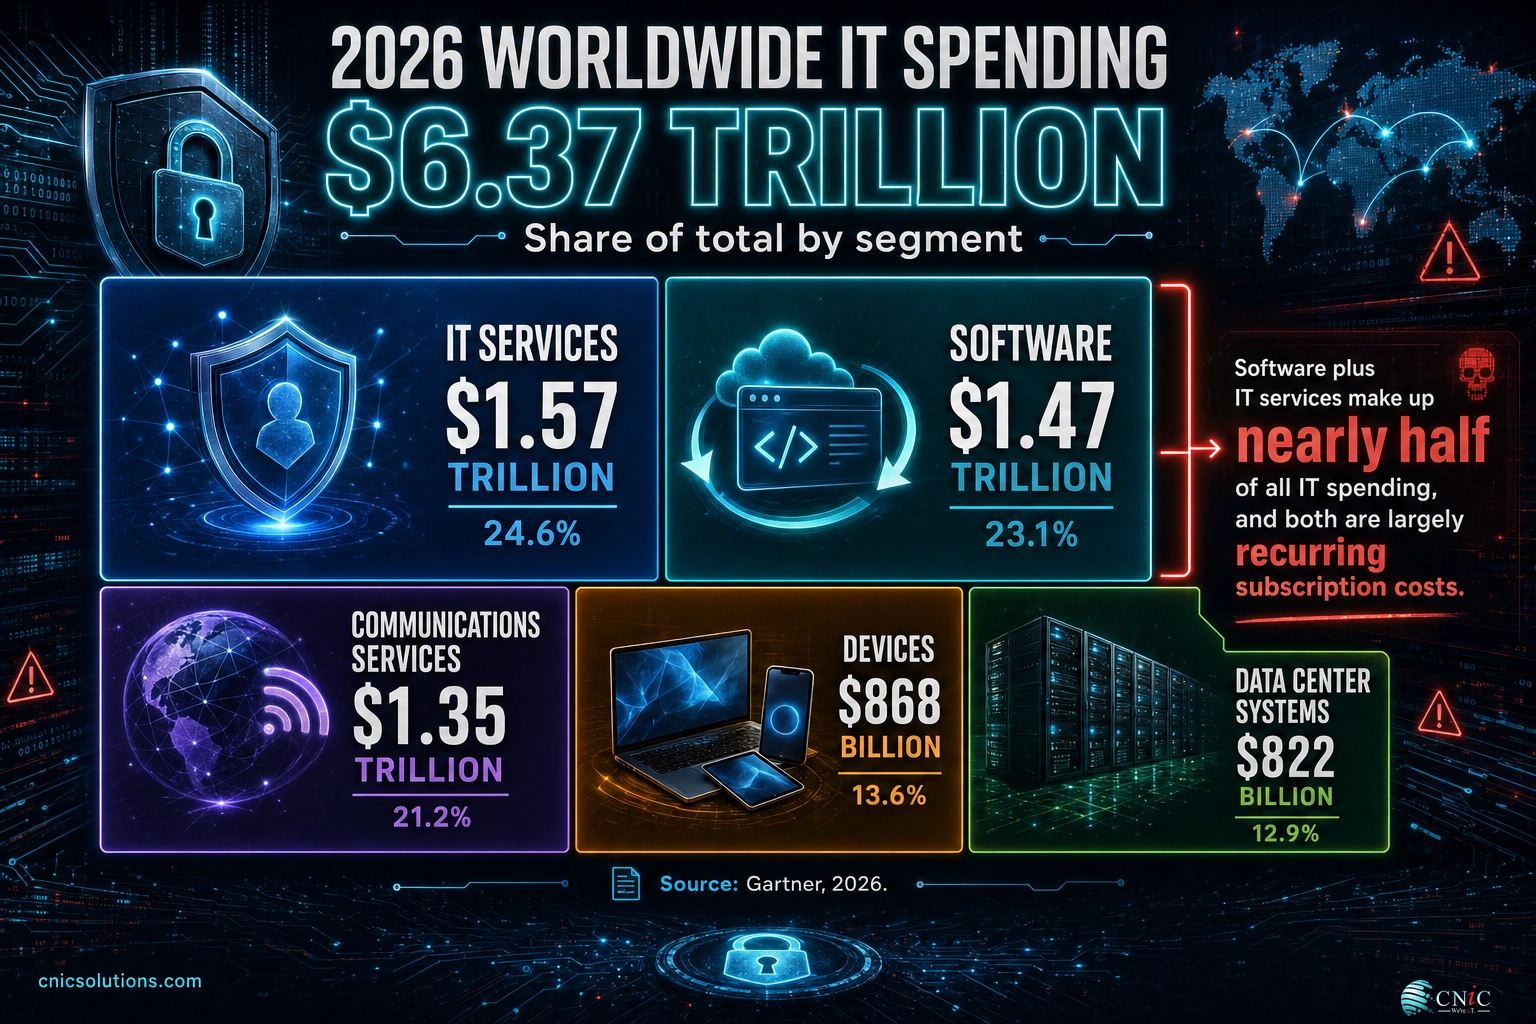
There is an important nuance in the mix. Software and IT services together account for about $3.04 trillion, nearly half of all IT spending, and both are largely recurring, subscription-based costs rather than one-time purchases. That reflects a decade-long shift away from buying and owning hardware toward paying for outcomes and access, a shift that shapes how businesses of every size now build their budgets.
CNiC Solutions Analysis: The AI Concentration. Gartner forecasts total IT spending to grow 14.2% in 2026. But strip out data center systems, which is growing 62.5% to $822 billion, and the picture changes sharply. Formula: 2026 non-data-center spending of about $5.55 trillion against an implied 2025 base of roughly $5.07 trillion works out to about 9.4% growth. In other words, nearly a third of the entire market’s dollar acceleration is concentrated in one AI-driven segment, and the “typical” business, which buys almost none of that data center capacity directly, lives in the 9% world, not the 14% one. Calculation and interpretation original to CNiC Solutions.
Source: Gartner Worldwide IT Spending Forecast, July 2026
Keeping that expanding base of infrastructure and services running reliably, without runaway cost, is the day-to-day work of proactive infrastructure management.
Get Proactive Infrastructure Management
3AI Is the Engine Behind the Numbers
Every one of those upward revisions traces back to the same cause. Gartner forecasts worldwide spending on artificial intelligence will total roughly $2.59 trillion in 2026, a 47% increase over the prior year. That AI figure is a cross-cutting lens rather than a sixth segment: it spans AI infrastructure, AI models, AI services, and AI-enabled applications, and it overlaps with the data center, software, and services spending already counted in the $6.37 trillion total. The point is direction, not addition. AI is now the center of gravity for technology investment.
| AI spending metric | Figure | Source |
|---|---|---|
| Total worldwide AI spending, 2026 | ~$2.59 trillion (+47%) | Gartner 2026 |
| AI infrastructure share of AI spend | 45%+ (largest slice) | Gartner 2026 |
| AI models growth, 2026 | +110% | Gartner 2026 |
| AI-optimized servers, 5-year outlook | Roughly triple | Gartner 2026 |
Most of this money is being spent by a narrow group. Gartner notes that AI spending has so far been driven by technology companies and hyperscalers building capacity, with everyday enterprises only beginning to flex their own budgets. Gartner has called 2026 the likely inflection year, the point where AI shifts from a supplier-side buildout to something ordinary businesses buy and deploy. Spending on AI-optimized servers is forecast to roughly triple over the next five years, and the short-term outlook for AI models was raised to 110% growth in 2026.
Myth: “AI is a line item every business needs to fund right now.” The trillion-dollar AI numbers describe hyperscalers building data centers, not the average small business budget. For most companies, the practical AI question in 2026 is narrower: which tools already inside your software, your help desk, your security stack, deliver real value, and which are hype you would be paying for twice. Chasing the headline is how budgets get wasted. Adopting AI where it measurably saves time is how they get returns.
For a growing business, the sensible move is to treat AI as a feature to evaluate inside tools you already use, not a mandate to fund a separate initiative. That evaluation, and the guardrails around it, is a strategic decision worth getting right before the spending starts.
Source: Gartner Worldwide AI Spending Forecast, May 2026
Deciding where AI genuinely fits, and where it does not, is a good example of the roadmap work a fractional technology leader brings to a growing company.
See How AI-Enhanced IT Services Work

4Cybersecurity: The Line Item Nobody Cuts
If AI is the fastest-growing area of technology spending, security is the most durable. Gartner expects worldwide end-user spending on information security to grow about 12.5% in 2026 to roughly $240 billion, up from $213 billion in 2025. Unlike discretionary projects, security spending tends to hold or rise even when budgets tighten, because the cost of getting it wrong keeps climbing and regulators and insurers keep raising the bar.
| Information security metric | Figure | Source |
|---|---|---|
| End-user info security spending, 2025 | $213 billion | Gartner 2025 |
| End-user info security spending, 2026 | ~$240 billion (+12.5%) | Gartner 2026 |
| Fastest-growing subsegment | Cloud security, +28.8% | Gartner 2026 |
| Recommended share of IT budget | 10% to 20% | Deloitte |
Two forces are pushing security spend up at once. First, the move from on-premises systems to cloud keeps expanding the attack surface, which is why cloud security is the fastest-growing subsegment at 28.8%. Second, AI cuts both ways: businesses are spending more to secure the AI tools they adopt, and to defend against attackers who now use AI to scale phishing and reconnaissance. The result is that security has become a permanent, growing share of the budget rather than a one-time project.
How much of the IT budget should be security? Deloitte research points to a common range of 10% to 20% of the IT budget dedicated to cybersecurity and recovery planning. The right number depends on your industry and regulatory exposure: a medical practice or law firm handling sensitive records sits at the higher end, a low-data business at the lower. The mistake is treating it as optional. Security is the one line item where underspending shows up later as a far larger, unbudgeted incident cost.
Because attackers move fast, spending on continuous monitoring and rapid patching consistently outperforms a once-a-quarter approach, a pattern documented in our patch management statistics for 2026.
Source: Gartner Information Security Spending Forecast | Deloitte Global Technology Leadership Study
Putting that 10% to 20% to work as continuous protection, rather than a pile of tools nobody manages, is the job of a managed security program.
Explore CNiC Cybersecurity Services
5What Small and Midsize Businesses Actually Spend
The trillion-dollar totals can make it sound as if IT spending is an enterprise story. It is not. IDC estimates that small and midsize businesses will spend about $1.18 trillion on IT globally in 2026, up roughly 7.2% from $1.1 trillion in 2025. Widen the lens to include the midmarket and Techaisle puts worldwide SMB and midmarket IT spend at about $1.667 trillion. Small and midsize businesses are, collectively, one of the largest technology buyers on the planet.
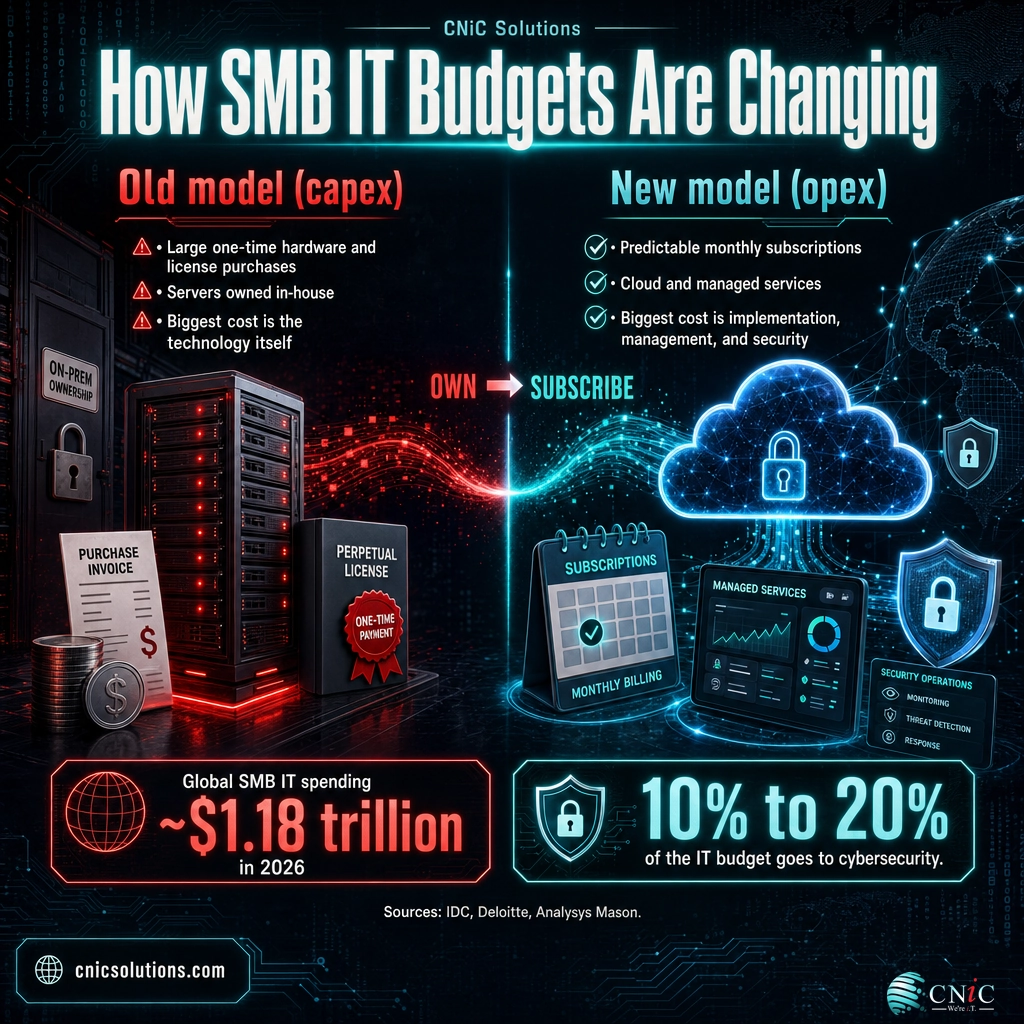
What matters more than the totals is the change in shape. SMB budgets are shifting from capital expenditure, buying servers and perpetual software licenses, to operating expenditure, paying monthly for cloud, subscriptions, and managed services. Industry analysts note that SMBs now often spend more on the implementation, integration, management, and security of technology than on the technology itself. The product is no longer the expensive part. Making it work, keeping it running, and keeping it safe is.
| SMB IT spending shift | Old model (capex) | New model (opex) |
|---|---|---|
| How you pay | Large one-time purchases | Predictable monthly subscriptions |
| What you buy | Servers, licenses, hardware | Cloud, SaaS, managed services |
| Biggest cost | The technology itself | Implementation, management, security |
| Who runs it | In-house staff or ad-hoc break-fix | Managed provider or hybrid team |
| Budget risk | Surprise capital outlays | Scope creep in recurring spend |
That shift is why the build-versus-buy decision has become central to SMB budgeting. Hiring, training, and retaining in-house IT staff is a fixed cost that scales poorly for a small team, while a managed model converts it into a predictable line item. We break the numbers down in our comparison of the real cost of in-house versus outsourced IT, and in a step-by-step walkthrough of how to build a small business IT budget.
The subscription trap to watch. Moving to opex is smart, but recurring costs are easy to lose track of. SaaS sprawl, forgotten licenses, and over-provisioned cloud are the SMB equivalent of a gym membership nobody uses. The businesses that budget well do not just sign up for services, they review them, and cloud waste in particular is a well-documented drain that a deliberate cloud cost optimization effort can recover.
Source: Analysys Mason SMB IT Spending Trends | Techaisle SMB and Midmarket IT Spend 2026
Migrating from owned hardware to cloud, without the surprise bills, is a core part of a well-planned IT budget.
Plan a Cost-Controlled Cloud Migration
6How Much Should You Spend? IT Budget Benchmarks
This is the question business owners actually ask, and the honest answer is a range, not a number. Deloitte’s Global Technology Leadership Study, based on a survey of 1,179 senior technology leaders, found the average technology budget is about 5.49% of revenue, up from 4.25% in 2020. But the average hides enormous variation. Deloitte’s data shows banking and financial services spending close to 8% of revenue on technology, while construction and manufacturing frequently spend under 2%.
The pattern is intuitive once you see it. The more a business runs on technology, and the more sensitive the data it handles, the higher its IT spend as a share of revenue. A bank is essentially a technology company with a banking license. A construction firm runs on people and equipment first. Where your business sits on that spectrum matters far more than the global average.
IT Spending as a Share of Revenue, by Industry (Approximate)
Industry figures are approximate benchmark midpoints and vary by company size and region. Source: Deloitte, Avasant Computer Economics.
Myth: “There is a single right percentage to spend on IT.” Benchmarks are a starting point, not a target. Two same-size companies in the same industry can justifiably spend very differently: one may be modernizing after years of neglect, the other coasting on recent investment. Spending 5% of revenue on IT that is poorly managed is worse than spending 3% on IT that is well run. The percentage matters less than what the money buys and whether it maps to real business risk and opportunity.
The most useful way to use these benchmarks is as a sanity check. If you are a professional services firm spending 1% of revenue on IT, you are almost certainly underinvesting and carrying hidden risk. If you are spending 12% with little to show for it, the problem is allocation, not budget size. A structured budget process, tied to business goals rather than last year’s number plus a bit, is what turns a percentage into a plan.
Source: Deloitte, Maximizing the Value of Technology Investments | Avasant Computer Economics IT Spending Benchmarks
Building that budget around business goals, and keeping it honest year over year, is exactly what a fractional technology leader does for companies without a full-time executive on staff. That is the difference between a number on a spreadsheet and a plan.
Summary Table: Every Stat at a Glance
| Statistic | Figure | Source | Year |
|---|---|---|---|
| Worldwide IT spending | $6.37 trillion | Gartner | 2026 |
| Worldwide IT spending growth | +14.2% | Gartner | 2026 |
| Implied 2025 worldwide IT spending | ~$5.58 trillion | Gartner | 2025 |
| Data center systems spending | $822 billion | Gartner | 2026 |
| Data center systems growth | +62.5% | Gartner | 2026 |
| IT services spending | $1.57 trillion | Gartner | 2026 |
| Software spending | $1.47 trillion | Gartner | 2026 |
| Software spending growth | +15.5% | Gartner | 2026 |
| Communications services spending | $1.35 trillion | Gartner | 2026 |
| Devices spending | $868 billion | Gartner | 2026 |
| Infrastructure-as-a-service spending | $287 billion (+29.3%) | Gartner | 2026 |
| Worldwide AI spending | ~$2.59 trillion | Gartner | 2026 |
| Worldwide AI spending growth | +47% | Gartner | 2026 |
| AI infrastructure share of AI spend | 45%+ | Gartner | 2026 |
| Information security spending | ~$240 billion (+12.5%) | Gartner | 2026 |
| Information security spending (prior year) | $213 billion | Gartner | 2025 |
| Cloud security growth | +28.8% | Gartner | 2026 |
| Global SMB IT spending | ~$1.18 trillion (+7.2%) | IDC | 2026 |
| Worldwide SMB & midmarket IT spending | ~$1.667 trillion | Techaisle | 2026 |
| Average technology budget, share of revenue | 5.49% | Deloitte | 2023-2025 |
| Banking & financial services IT, share of revenue | ~8% | Deloitte | 2023-2025 |
| Typical IT-spend-of-revenue range | 2% to 10% | Avasant / Gartner | 2025-2026 |
| Recommended cybersecurity share of IT budget | 10% to 20% | Deloitte | 2025 |
Frequently Asked Questions
How much will businesses spend on IT in 2026?
What is driving IT spending growth in 2026?
How much should a business spend on IT as a percentage of revenue?
How much are small and midsize businesses spending on IT?
How much of an IT budget should go to cybersecurity?
Methodology and Sources
How we compiled this report
Every figure in this article comes from a named primary source: analyst-firm forecasts with disclosed methodology and benchmark providers that publish their own original research. We did not use secondary blog aggregations or unattributed “up to X%” claims. Where a figure is a forecast or varies by source, we say so and round rather than overstate precision. The AI spending total is a cross-cutting Gartner lens that overlaps with the IT spending segments, not an additional figure on top of the $6.37 trillion, and we flag that in the text. Derived figures, such as the AI concentration calculation, are clearly labeled as CNiC Solutions analysis with the source data and formula shown.
Primary sources cited:
- Gartner Worldwide IT Spending Forecast, July 2026: total IT spending, segment spending and growth rates.
- Gartner Worldwide AI Spending Forecast, May 2026: AI spending total, growth, and infrastructure share.
- Gartner Information Security Spending Forecast: end-user information security spending and cloud security growth.
- Deloitte Global Technology Leadership Study: technology budget as a share of revenue and cybersecurity budget share.
- Analysys Mason SMB IT Spending Trends: SMB spending trends and cybersecurity growth.
- Techaisle SMB and Midmarket IT Spend 2026: worldwide SMB and midmarket IT spend.
- Avasant Computer Economics IT Spending Benchmarks: IT spend as a share of revenue by industry and company size.
IDC’s Worldwide Small and Medium Business IT Spending Guide is the source for the global SMB IT spending estimate of approximately $1.18 trillion in 2026.
Media and press usage. Journalists, analysts, and bloggers are welcome to cite the statistics in this report with attribution to CNiC Solutions and a link back to this page. The AI concentration calculation and interpretation are original to CNiC Solutions. CNiC Solutions is a managed IT and cybersecurity provider; where this report recommends managed IT, virtual CIO, or managed security services, it reflects CNiC’s own service model, disclosed for transparency.



related posts
Microsoft 365 Business Premium vs Office 365 E3: Which Is Right for…
September 20, 2026Here is the short answer most buyers do not expect: Microsoft 365 Business Premium costs less…
McAfee Scam Emails: How to Spot Fake Renewal Notices
September 20, 2026A fake McAfee renewal email is one of the most common scams landing in business inboxes…
Managed Services Statistics: Market Size, Growth, and Adoption Data
September 19, 2026The global managed services market is on track to pass $430 billion in 2026, and by…
Malware Statistics for 2026: Volume, Variants, and the Shift to Malware-Free Attacks
September 19, 2026Security vendors now track more than 1.5 billion known malware samples, and the AV-TEST Institute registers…