

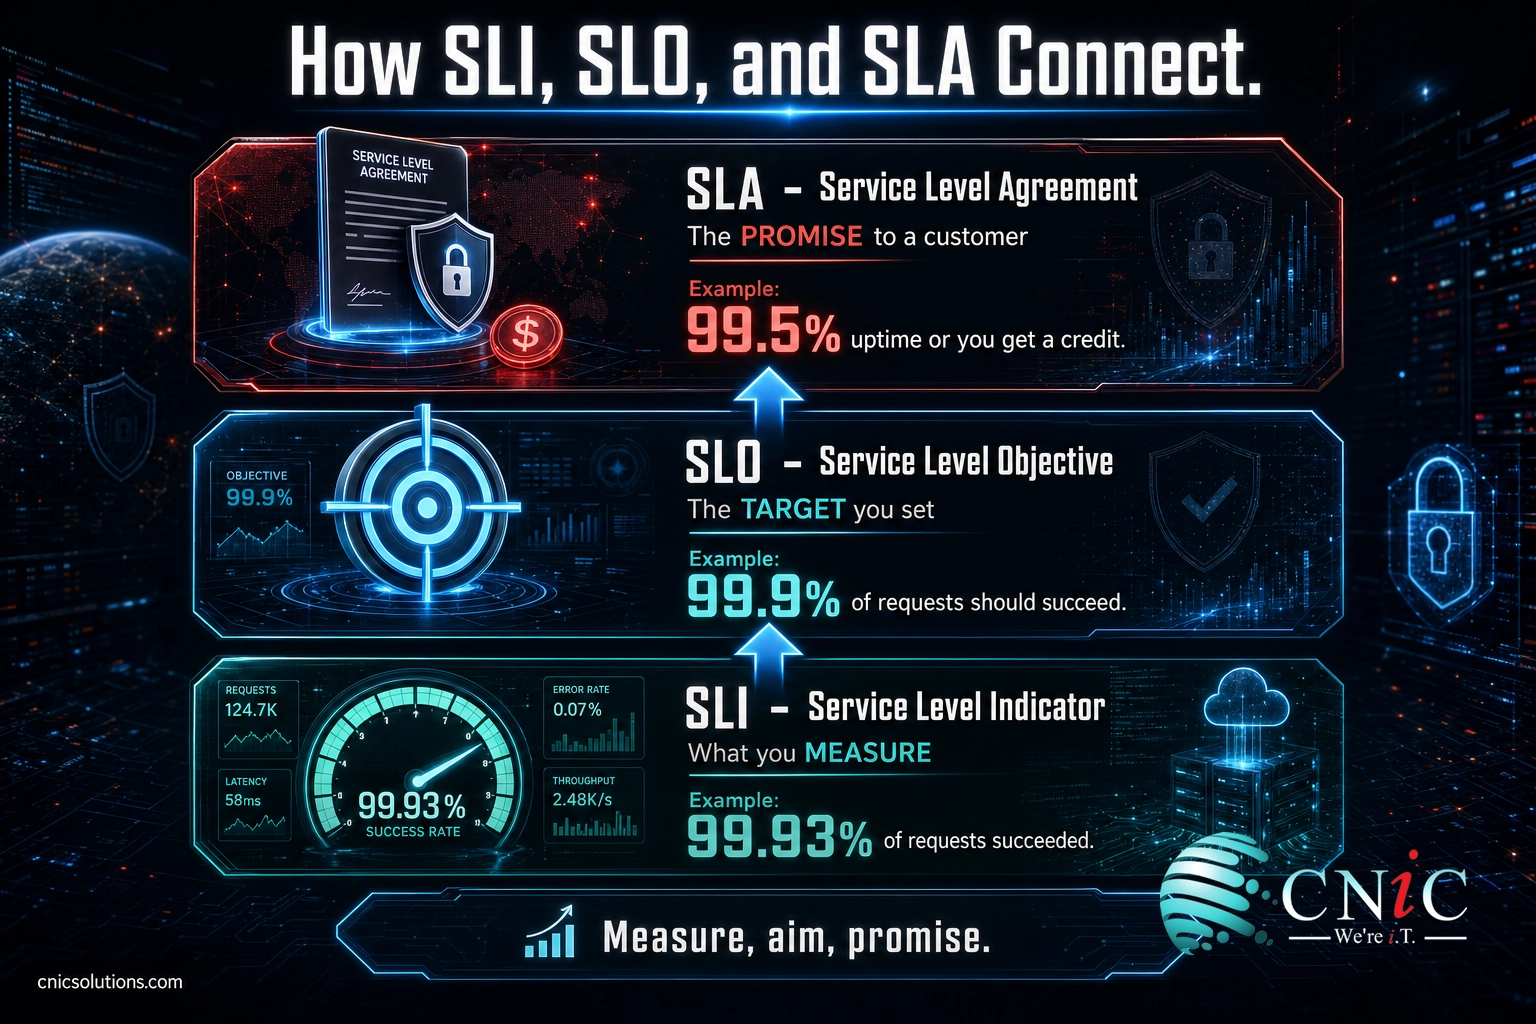
SLA, SLO, and SLI are three related pieces of how technology reliability gets measured and promised, and they are easy to mix up because they sound almost identical. Here is the short version: an SLI (service level indicator) is a number that measures how your service is actually performing. An SLO (service level objective) is the internal target you set for that number. An SLA (service level agreement) is the formal promise you make to a customer, with real consequences if you miss it. The SLI measures, the SLO aims, and the SLA promises. Get that order straight and everything else falls into place.
The one-line version: an SLI is a metric, an SLO is the target for that metric, and an SLA is the contractual promise built on top of it. The SLI tells you how the service is doing, the SLO defines how good is good enough, and the SLA spells out what the customer is owed if you fall short. Measure, aim, promise, in that order.
- Three roles, one chain: the SLI is what you measure, the SLO is the target you hold that measurement to, and the SLA is the promise to a customer with consequences attached if you miss.
- The order only runs one way. You cannot set a meaningful SLO without an SLI to measure, and an honest SLA is built on an SLO you can actually hit.
- Your SLO should be stricter than your SLA. Google runs a 99.95 percent internal target behind a 99.9 percent customer promise. That gap is the safety buffer that keeps a bad day from becoming a contract breach.
- “99.9 percent uptime” is not “always on.” It still allows 8.76 hours of downtime a year, and outages are expensive: 54 percent of organizations said their most recent significant outage cost more than $100,000.
- For most businesses, the SLA is the part that matters most, because it is what you are actually buying from an IT provider. Read it for response times, coverage hours, and real remedies, not just a big uptime number.
What’s in This Guide
- Why These Three Acronyms Matter to Your Business
- SLI: Service Level Indicator (What You Measure)
- SLO: Service Level Objective (The Target You Set)
- SLA: Service Level Agreement (The Promise You Make)
- How SLI, SLO, and SLA Fit Together
- SLA vs. SLO vs. SLI: Side by Side
- What the Numbers Really Mean: The “Nines” of Uptime
- What to Look For in a Real IT Service Agreement
- Related Terms
- Frequently Asked Questions
Why These Three Acronyms Matter to Your Business
These terms come from the world of site reliability engineering, but they are not just for engineers. Every time you sign a contract with a cloud provider, a software vendor, or a managed IT company, you are agreeing to an SLA, whether you read it closely or not. Understanding what sits behind that promise, the objectives and the measurements, is what tells you whether the promise is meaningful or just marketing.
The stakes are real because downtime is expensive. In the Uptime Institute’s 2024 Annual Outage Analysis, 54 percent of operators said their most recent significant outage cost more than $100,000, and one in five said it topped $1 million. An SLA is the contractual answer to a simple question: when a system you depend on goes down, what are you actually owed, and how fast will it come back?
Here is the trap most business owners fall into: they focus entirely on the SLA number, the “99.9 percent uptime” line, and ignore whether the provider has the objectives and monitoring to back it up. A promise with no measurement behind it is a guess. That is why it pays to understand all three terms, starting from the ground up with the one that measures reality.
Source: Uptime Institute, 2024 Annual Outage Analysis
SLI: Service Level Indicator (What You Measure)
A service level indicator is a specific, quantitative measurement of one aspect of how a service is performing, framed from the user’s point of view. It is the raw reading on the dial. Google’s Site Reliability Engineering team defines it as “a carefully defined quantitative measure of some aspect of the level of service that is provided.” If you cannot measure it, it is not an SLI.
Common examples of SLIs
- Availability: the percentage of time a service is up and reachable, for example “the system was available 99.93 percent of the last 30 days.”
- Latency: how long a request takes, for example “95 percent of page loads completed in under 400 milliseconds.”
- Error rate: the fraction of requests that fail, for example “0.05 percent of requests returned an error.”
- Throughput: how much work the system handles, such as requests per second.
Think of an SLI as the thermometer. It does not tell you whether the patient is healthy; it just reports the temperature accurately. The judgment about what counts as healthy comes next, in the objective. A good SLI measures something a user genuinely feels. “The server CPU was under 80 percent” is a system metric, but “requests completed successfully and quickly” is closer to what an SLI should capture, because it reflects the actual experience.
Source: Google, Site Reliability Engineering: Service Level Objectives
SLO: Service Level Objective (The Target You Set)
A service level objective is the target value, or range of values, that you decide your SLI should hit. If the SLI is the thermometer reading, the SLO is the statement “a healthy temperature is between 97 and 99 degrees.” Google defines it as “a target value or range of values for a service level that is measured by an SLI.” It is the line between good enough and not good enough.
An SLO is internal. It is the goal your team holds itself to, and nobody outside the company necessarily sees it. A typical SLO reads like this: “99.9 percent of requests should succeed, measured over a rolling 28-day window.” Notice that it names the target (99.9 percent), the SLI it applies to (successful requests), and the time window (28 days). All three parts matter, because “99.9 percent uptime” means something very different measured over a day versus a year.
The error budget: the useful flip side of an SLO
Every SLO has a hidden twin called an error budget. If your objective is 99.9 percent success, then 0.1 percent failure is not a disaster, it is your budget. That leftover slice is the amount of unreliability you have decided you can tolerate. Google’s SRE practice treats this budget as something a team can spend deliberately, for example on releasing new features faster, as long as reliability stays inside the objective. The point is that perfect reliability is not the goal. The right amount of reliability, defined in advance, is the goal.
CNiC Solutions analysis: turning an SLO into an error budget. Error budget = 100 percent minus the SLO. A 99.9 percent monthly SLO leaves a 0.1 percent budget, which works out to about 43.2 minutes of allowed downtime in a 30-day month (0.1 percent of 43,200 minutes). Once that budget is spent, the priority shifts from shipping changes to protecting stability. Calculation and framing original to CNiC Solutions, based on Google SRE definitions.
Setting the right objective is a business decision as much as a technical one, because more reliability always costs more. That tradeoff, deciding how many nines a given system actually needs, is exactly the kind of call a Virtual CIO helps businesses make without over-buying or under-protecting.
Talk to a Virtual CIO About Your Targets
Source: Google, Site Reliability Engineering: Service Level Objectives | Google, Site Reliability Engineering: Embracing Risk (Error Budgets)
SLA: Service Level Agreement (The Promise You Make)
A service level agreement is the formal contract, explicit or implicit, between a provider and a customer that spells out the level of service the customer can expect and, crucially, the consequences if that level is not met. This is the term most business owners already know, because it is the one they sign. Google’s team offers the cleanest test for telling an SLA apart from an SLO: ask “what happens if the objectives are not met? If there is no explicit consequence, then you are almost certainly looking at an SLO,” not an SLA.
That consequence is what makes an SLA an agreement rather than an aspiration. A typical SLA clause reads: “If monthly availability falls below 99.5 percent, the customer receives a 10 percent service credit.” The credit is the enforcement mechanism. It is worth being clear-eyed about what that credit is, though: it compensates you against your bill, not against the revenue or productivity you lost while the system was down. An SLA manages risk and sets accountability. It does not make outages painless.
Myth: “We have an SLA, so our systems are guaranteed not to go down.” An SLA is a promise with a penalty, not a force field. It does not prevent outages; it defines what you are owed when one happens. And the number itself can lull you: a 99.9 percent uptime SLA still permits nearly nine hours of downtime a year. The real protection comes from the objectives, monitoring, and disaster recovery behind the SLA, which is why the contract is only as good as the operation standing behind it.
For a managed IT relationship, the SLA is the heart of what you are buying. It should cover far more than a single uptime figure, and we break down exactly what to look for later in this guide.
Source: Google, Site Reliability Engineering: Service Level Objectives
How SLI, SLO, and SLA Fit Together
The three terms are not competitors; they are a sequence. Each one builds on the one before it, and the relationship only works in a single direction:
- The SLI measures what is actually happening (99.93 percent of requests succeeded).
- The SLO sets the target for that measurement (we want 99.9 percent to succeed).
- The SLA promises a version of that target to a customer, with consequences (we guarantee 99.5 percent, or you get a credit).
Read from the bottom up, an SLA that is not backed by an SLO is a promise nobody is tracking, and an SLO with no SLI behind it is a target nobody can measure. That is why a serious provider can show you the monitoring, not just the contract.
The golden rule: your SLO should be stricter than your SLA
This is the single most important design principle connecting the three, and the one most often missed. Your internal objective should be tougher than the promise you make to customers, so that you have a buffer to catch and fix problems before you actually breach the agreement. Google’s guidance puts it plainly: the availability objective inside an SLA “is normally a looser objective than the internal availability SLO.” Their worked example pairs a 99.9 percent SLA with a stricter 99.95 percent internal SLO. That 0.05 percent gap is deliberate breathing room.
If your SLO and your SLA are set to the same number, you have no margin. The first bad afternoon puts you in breach with nothing held in reserve. Keeping the objective tighter than the promise is what turns reliability from a hope into a system, and it depends on continuous monitoring, the kind that proactive infrastructure management is built to provide.
Source: Google Cloud, SRE Fundamentals: SLIs, SLAs and SLOs
SLA vs. SLO vs. SLI: Side by Side
The fastest way to keep the three straight is to line them up against the same questions. The pattern is consistent: the SLI is data, the SLO is an internal goal, and the SLA is an external contract.
| Question | SLI (Indicator) | SLO (Objective) | SLA (Agreement) |
|---|---|---|---|
| What is it? | A measurement | A target | A contract |
| What does it answer? | How is the service doing? | How good is good enough? | What do we promise, and what if we miss? |
| Who is it for? | The IT or engineering team | The internal team | The customer or client |
| Example | 99.93% of requests succeeded | 99.9% of requests should succeed | 99.5% uptime or you get a credit |
| Consequence if missed | None; it is just data | Internal priority shift or fix | Financial penalty or service credit |
| Where it lives | A monitoring dashboard | An internal reliability plan | A signed contract |
One more distinction is worth holding onto: an SLI and an SLO are things a provider does for itself to run well. An SLA is something it does for you. When you are the customer, the SLA is what you can hold the provider to, while the SLO and SLI are the evidence that they can actually keep it.

What the Numbers Really Mean: The “Nines” of Uptime
Uptime targets are usually written as a string of nines, and the difference between them is bigger than it looks. Each additional nine cuts the allowed downtime by roughly a factor of ten, and each one is dramatically harder and more expensive to deliver. The math is simple arithmetic on the 525,600 minutes in a year, and it turns an abstract percentage into something you can actually plan around.
Moving from 99.9 percent to 99.99 percent sounds like a rounding error, but it shrinks allowed downtime from about 8.76 hours a year to under an hour. The ladder below shows how steep each additional nine really is.
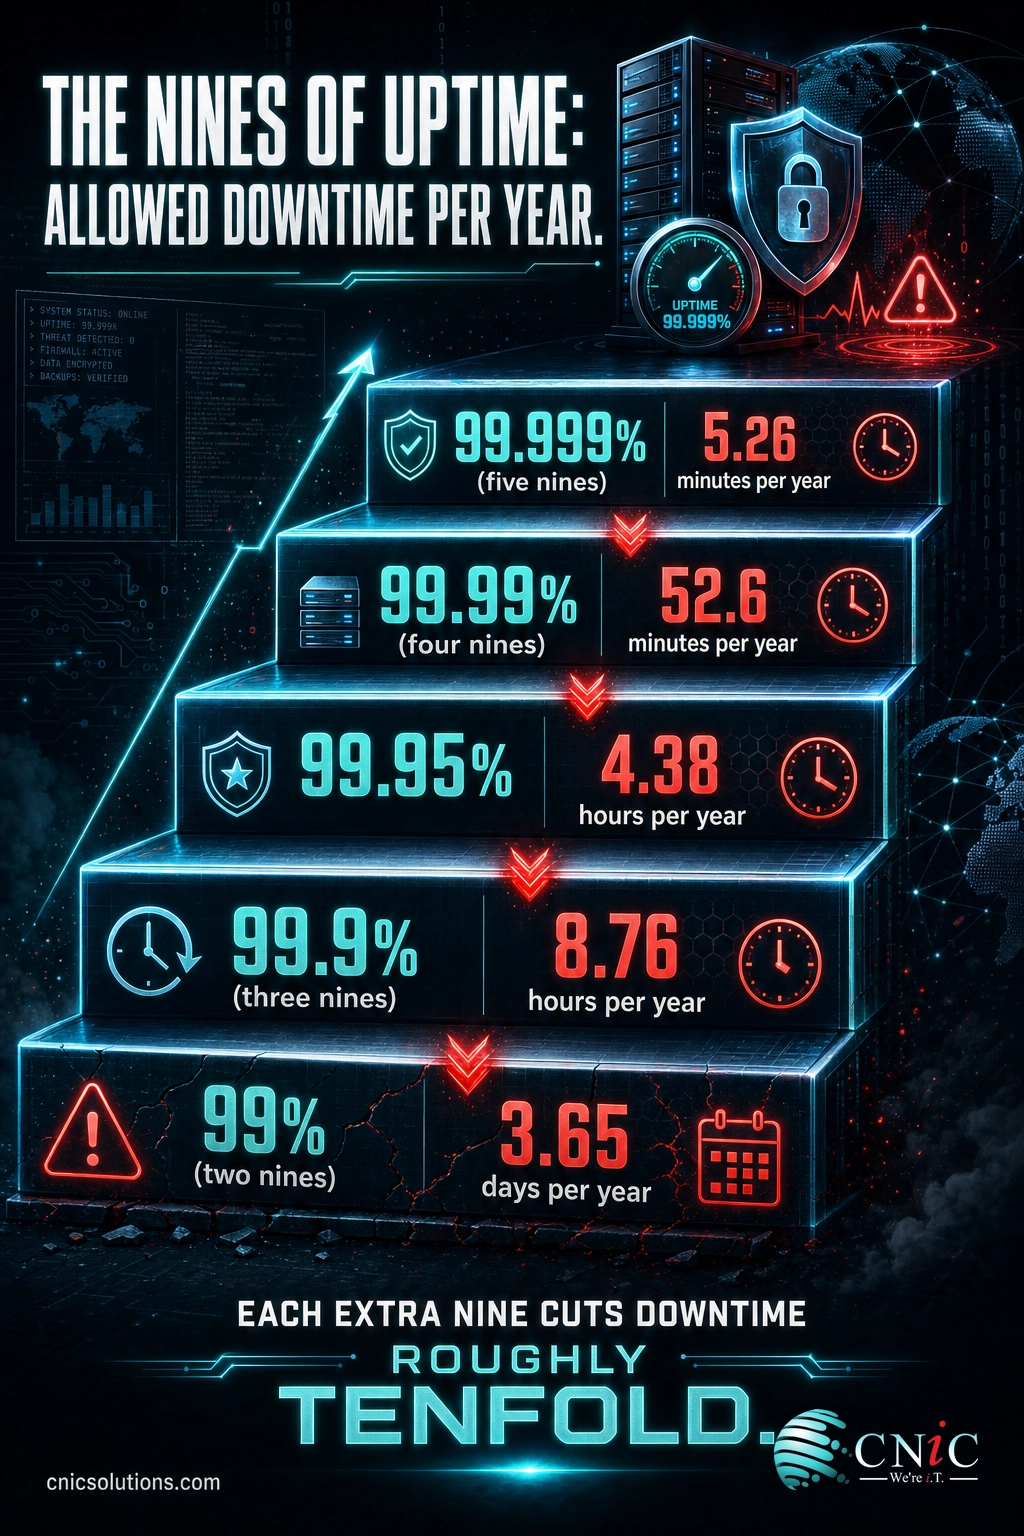
The full picture across the common tiers makes the jump between levels concrete:
| Uptime | Common name | Downtime per year | Downtime per month |
|---|---|---|---|
| 99% | Two nines | 3.65 days | 7.3 hours |
| 99.9% | Three nines | 8.76 hours | 43.8 minutes |
| 99.95% | (no standard name) | 4.38 hours | 21.9 minutes |
| 99.99% | Four nines | 52.6 minutes | 4.38 minutes |
| 99.999% | Five nines | 5.26 minutes | 26 seconds |
The practical lesson is not to chase the most nines. It is to match the target to the real cost of downtime for a given system. Your accounting platform during month-end close may justify four nines; an internal wiki probably does not. Every additional nine you demand raises the price of the infrastructure, redundancy, and monitoring needed to hit it, so the right question is always “what does an hour of downtime on this specific system actually cost us?” The answer shapes the objective, and the objective shapes what you should be willing to pay for in an SLA. Systems where availability is non-negotiable also lean heavily on backup and disaster recovery planning, so that a failure becomes a short recovery rather than a long outage.
What to Look For in a Real IT Service Agreement
When you evaluate a managed IT provider, cloud vendor, or software contract, the SLA is where the promise becomes specific. A strong one goes well beyond a single uptime figure. Use this as a checklist when you read the fine print.
- Availability target, and for what. A number like 99.9 percent means little without knowing which systems it covers and how uptime is measured.
- Response time vs. resolution time. How fast the provider acknowledges an issue is not the same as how fast they fix it. Good agreements define both, often by severity level.
- Coverage hours. Business hours only, extended hours, or true 24/7? An outage at 2 a.m. is only covered if the contract says so.
- How downtime is defined. Look for what counts, and what is excluded, such as scheduled maintenance windows or outages caused by your own equipment.
- The remedy. What you actually receive when a target is missed, usually a service credit, and how you claim it.
- Reporting. A provider confident in its numbers will report performance to you regularly, not only when you ask.
Watch for vague language. Phrases like “commercially reasonable efforts,” “best effort,” or “target uptime” with no penalty attached are objectives dressed up as agreements. Remember the test: if missing the number carries no defined consequence, it is not really an SLA. The value of the whole document lives in the specifics, so the fuzzier the wording, the less you are actually being promised.
The reason all of this matters is that an SLA is the contractual shape of your operational risk. It tells you, in advance, what a provider owes you when something breaks and how quickly normal service returns. That is the core of what a managed IT partner is for: setting realistic objectives, monitoring the indicators that prove they are met, and standing behind an agreement written in plain, specific terms.
Related Terms
Uptime / Availability: the percentage of time a system is operational and reachable. It is the SLI most SLAs are built around.
Error budget: the amount of unreliability you allow yourself, calculated as 100 percent minus your SLO. A 99.9 percent objective leaves a 0.1 percent error budget.
MTTR (Mean Time to Repair): the average time it takes to restore service after a failure. Lower MTTR is often what a resolution-time SLA is really measuring.
MTBF (Mean Time Between Failures): the average time a system runs before it fails. Higher MTBF means fewer outages to recover from.
RTO / RPO: Recovery Time Objective (how fast you must be back up) and Recovery Point Objective (how much data you can afford to lose), the two targets at the center of disaster recovery planning.
Response time: how quickly a provider acknowledges a reported issue, distinct from how long the fix takes. A common, and important, SLA metric.
Frequently Asked Questions
What is the difference between an SLA, an SLO, and an SLI?
Is an SLA the same as an uptime guarantee?
What is a good SLA uptime percentage for a business?
Why should an SLO be stricter than an SLA?
What should a good managed IT services SLA include?
Sources and Methodology
This guide draws its definitions from primary site reliability engineering sources and its downtime figures from standard availability arithmetic. Term definitions follow Google’s Site Reliability Engineering material. Outage cost figures come from the Uptime Institute. The “nines” downtime values are calculated directly from the 525,600 minutes in a standard 365-day year.
- Google, Site Reliability Engineering: Service Level Objectives (definitions of SLI, SLO, and SLA; the “what happens if it is missed” test)
- Google, Site Reliability Engineering: Embracing Risk (the error budget concept)
- Google Cloud, SRE Fundamentals: SLIs, SLAs and SLOs (SLO stricter than SLA; 99.9% SLA with a 99.95% internal SLO)
- Uptime Institute, 2024 Annual Outage Analysis (54% of significant outages cost over $100,000; 20% over $1 million)
Downtime-per-year and per-month figures are computed by CNiC Solutions from the definition of availability (100 percent minus uptime, applied to 525,600 minutes per year). Interpretation and the evaluation checklist are original to CNiC Solutions.



related posts
What Is a Firmware Update and Why It Matters for Security
October 6, 2026A firmware update is a manufacturer-issued revision to the low-level software built into a device, such…
What Is a Human Firewall? Turning Employees Into Your Best Defense
October 6, 2026A human firewall is the group of employees who, through security awareness and good habits, act…
What Is a Distributed System? How It Works and Why It Matters
October 5, 2026A distributed system is a collection of independent computers, called nodes, that are connected over a…
What Is a Firewall? How It Protects Your Business Network
October 5, 2026A firewall is a network security device or software that monitors incoming and outgoing traffic and…