
Telemetry is the automated collection and transmission of data from IT systems (servers, networks, applications, and devices) to a central location where it can be analyzed. It is the raw machine data that reveals what your technology is doing at any moment, and it is the foundation that monitoring, observability, and AI-driven IT all depend on.
Every server, network device, and application your business runs is constantly generating data about itself: how hard it is working, what just happened, and whether anything went wrong. Telemetry is the practice of collecting and shipping that machine data somewhere it can be put to use. On its own, that may sound like plumbing, but it is the foundation underneath nearly every modern IT capability that matters, from catching problems before they cause downtime to powering the AI and predictive tools transforming how IT is run. This guide explains what telemetry is, the three types of data it produces, how it differs from monitoring and observability, and why it is the fuel behind AI-driven IT.
Key Takeaways
- Telemetry is the data layer. It is the automated collection of machine data from your systems, not the analysis of it.
- It has three pillars: metrics, logs, and traces, each answering a different question about system behavior.
- Telemetry feeds monitoring and observability. Monitoring alerts you; observability explains why; both run on telemetry data.
- It is the fuel for AI-driven IT. Anomaly detection, predictive maintenance, and automated response all need a constant stream of telemetry to learn from.
- The data is only as useful as what you do with it. Collecting telemetry is the start; turning it into prevention is where a managed, AI-enhanced approach pays off.
What’s in This Guide
How Telemetry Works
The word telemetry comes from roots meaning “remote measurement,” and that is exactly what it does: it measures something happening in one place and transmits the reading somewhere else. In IT, the systems being measured are your servers, networks, cloud platforms, applications, and connected devices, and the destination is a central platform where the data can be stored, analyzed, and acted on.
In practice, the flow looks like this:
- Collection: Small agents or built-in instrumentation gather data from each system as it operates.
- Transmission: That data is automatically sent to a central location, continuously and in near real time.
- Storage and analysis: The data is aggregated so tools (and people) can spot trends, set alerts, and investigate issues.
The key word is automated. Telemetry is not someone manually checking a server; it is a constant, hands-off stream of machine data flowing from your environment to a place where it becomes useful. An open-source framework called OpenTelemetry (OTel) has become a popular, vendor-neutral standard for collecting this data consistently across different tools.
Source: IBM: What Is Telemetry?
The Three Types of Telemetry Data
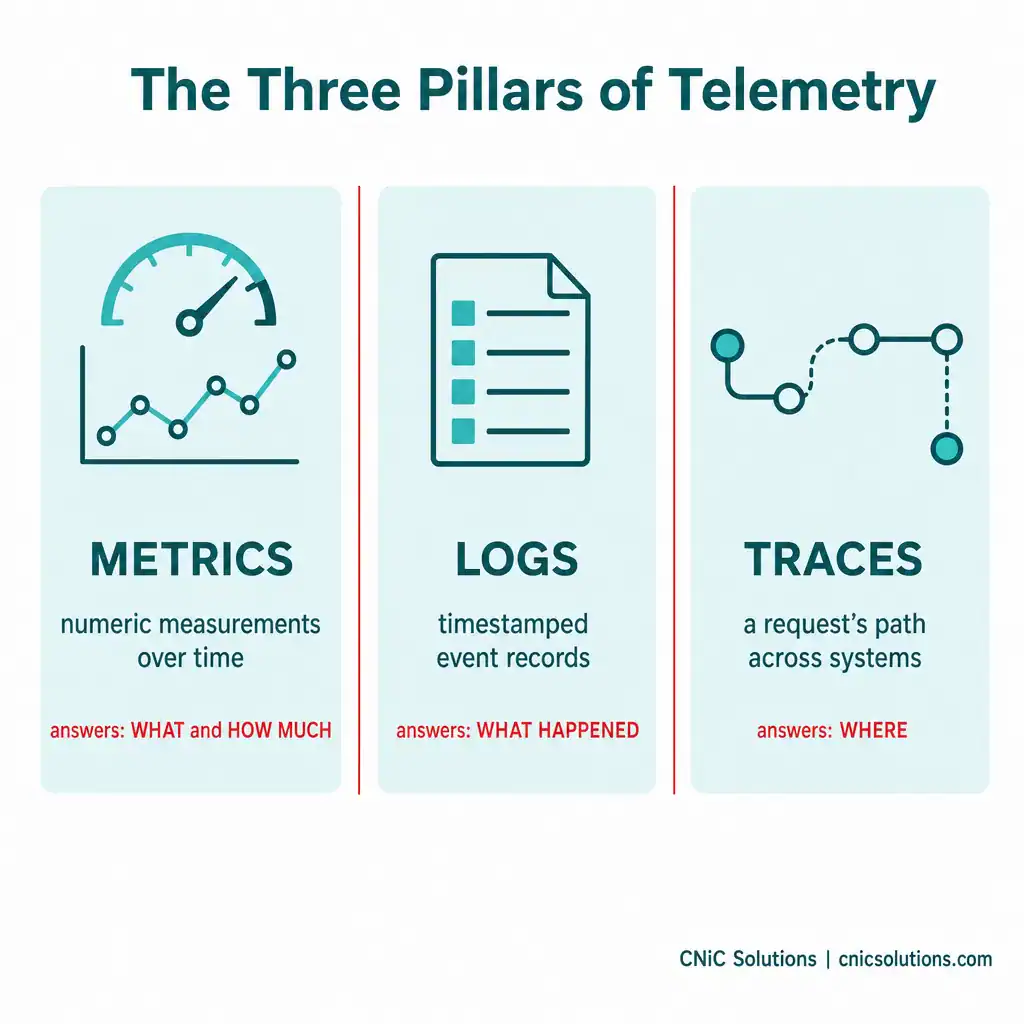
Telemetry data is usually grouped into three categories, often called the “three pillars.” Each answers a different question about what your systems are doing.
Metrics
Metrics are numeric measurements taken over time: CPU usage, memory consumption, request rates, error counts, response times. They are compact and efficient, which makes them ideal for spotting trends and triggering alerts (for example, “memory usage crossed 90%”). Metrics tell you what is happening and how much.
Logs
Logs are timestamped records of discrete events: an error was thrown, a user logged in, a service restarted. Where metrics give you the numbers, logs give you the detailed, event-by-event story. When something breaks, logs are usually where you look to understand exactly what occurred and when.
Traces
Traces follow a single request as it travels across multiple systems, showing the full path and how long each step took. In modern environments where one user action might touch a dozen services, traces are how you pinpoint where a slowdown or failure actually happened, rather than guessing.
Why all three matter: Metrics tell you something is wrong, logs tell you what happened, and traces tell you where. Used together, they turn a vague “the system feels slow” into a precise, fixable diagnosis. This is the raw material every monitoring and observability tool depends on.
Telemetry vs Monitoring vs Observability
These three terms get used interchangeably, but they describe different layers that build on each other. The cleanest way to think about it: telemetry is the data, monitoring watches it, and observability explains it.
| Concept | What it is | The question it answers |
|---|---|---|
| Telemetry | The automated collection and transmission of machine data (metrics, logs, traces) | What is the system doing? (the raw data) |
| Monitoring | Watching telemetry against predefined thresholds and alerting on problems | Is something wrong right now? |
| Observability | Analyzing all available telemetry to understand system behavior | Why is this happening? |
The important relationship is the dependency: monitoring and observability both run on telemetry. Without good telemetry data flowing in, monitoring has nothing to alert on and observability has nothing to analyze. That is why telemetry is described as the foundation: it is the input that makes everything above it possible. If you want the deeper picture of what businesses do with this data day to day, see our guide on what infrastructure monitoring is.
How Telemetry Powers AI-Driven IT
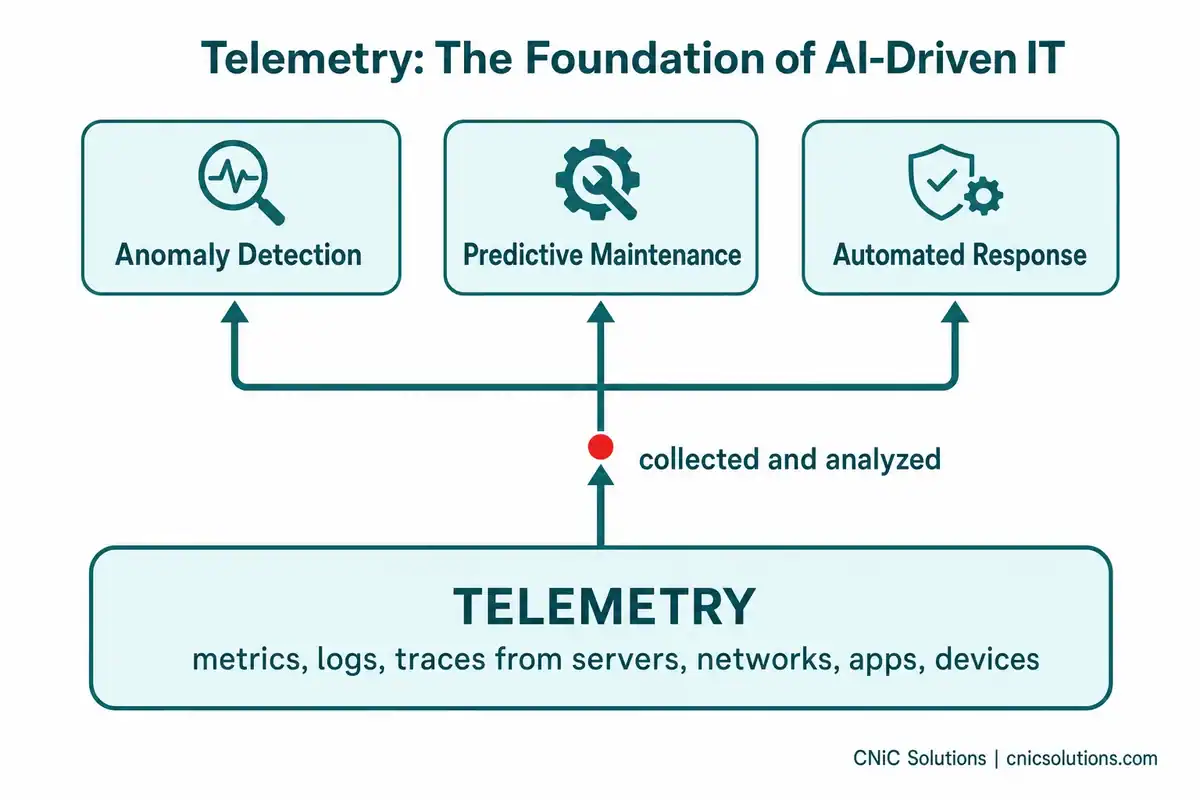
Here is where telemetry stops being plumbing and becomes a competitive capability. Artificial intelligence and machine learning are only as good as the data they learn from, and in IT, that data is telemetry. The constant stream of metrics, logs, and traces is precisely what AI systems need to find patterns no human could spot in real time.
This is the engine behind several of the most valuable modern IT capabilities:
- Anomaly detection: Instead of waiting for a metric to cross a fixed threshold, AI learns what “normal” looks like for your environment and flags subtle deviations that signal a problem forming, often before any traditional alert would fire.
- Predictive maintenance: By analyzing long-term telemetry trends, AI can forecast when a server is heading toward capacity or a component is likely to fail, so it can be addressed before it causes downtime.
- Automated response: When telemetry patterns match a known issue, automated systems can take corrective action, such as reallocating resources, without waiting for a person to intervene.
- AI model oversight: Telemetry also tracks AI systems themselves, monitoring things like model performance and accuracy over time so the AI stays reliable.
This shift, from reactive (“a server went down, now fix it”) to predictive (“this server will struggle next week, prevent it”), is one of the most significant changes in modern IT, and it is entirely built on telemetry. No telemetry, no AI-driven IT.
Source: IBM: What Is Telemetry?
Why Telemetry Matters for Your Business
For most business owners, telemetry is not something you will ever configure yourself, and you should not have to. What matters is the outcome it makes possible: technology that warns you before it breaks instead of after. The difference between a business that collects telemetry and one that actually uses it well is the difference between finding out about an outage from an angry customer and never having the outage at all.
The catch is that raw telemetry is just data. Collecting it is the easy part; turning a firehose of metrics, logs, and traces into early warnings and prevented downtime takes the right tools, the right thresholds, and increasingly, AI that can learn your environment. That is the work behind AI-enhanced IT services: CNiC Solutions uses telemetry and AI-driven analysis to monitor your entire environment, catch anomalies early, and resolve issues before they reach your users, so you get the benefit of all that machine data without managing any of it.
See how AI-driven IT turns your machine data into prevented downtime
If you are weighing how telemetry, monitoring, and AI fit into a broader technology plan, a Virtual CIO can help map where these capabilities deliver the most value for your business.

Related Terms
- Metrics: Numeric measurements collected over time, such as CPU or memory usage.
- Logs: Timestamped records of individual events within a system.
- Traces: Records following a single request across multiple systems.
- Monitoring: Watching telemetry data against thresholds and alerting when issues occur.
- Observability: Analyzing telemetry to understand why a system behaves as it does.
- OpenTelemetry (OTel): A popular open-source, vendor-neutral framework for collecting telemetry data.
- AIOps: Applying AI and machine learning to IT operations data (telemetry) to automate detection and response.
- Predictive maintenance: Using telemetry trends to forecast and prevent failures before they happen.
Frequently Asked Questions
What is telemetry in simple terms?
What are the three types of telemetry data?
What is the difference between telemetry and monitoring?
How does telemetry support AI in IT?
What is OpenTelemetry?
Sources
The definition of telemetry, the three telemetry data types (metrics, logs, and traces), the distinction between telemetry, monitoring, and observability, and telemetry’s role as the data foundation for AI-driven IT reflect standard, widely documented characterizations in the IT industry. OpenTelemetry (OTel) is referenced as the open-source telemetry standard. The connection between telemetry and AI capabilities (anomaly detection, predictive maintenance, and AI model oversight such as tracking model performance over time) follows authoritative industry sources.
Primary source: IBM: What Is Telemetry?

related posts
What Is the Industrial Internet of Things (IIoT)?
June 25, 2026The Industrial Internet of Things (IIoT) is the use of connected sensors and intelligent devices on…
What Is Break-Fix IT? (vs Managed Services)
June 25, 2026Break-fix IT is a reactive support model where a business pays an IT provider only when…
What Is a Cron Job? Scheduling Tasks Explained
June 25, 2026A cron job is a command or script scheduled to run automatically at a set time…
IoT Monitoring: Keeping Connected Devices Secure and Online
June 25, 2026IoT monitoring is the continuous process of collecting and analyzing data from connected devices to keep…