

An OKR (Objective and Key Results) is a goal-setting framework that pairs an ambitious objective with the measurable key results that prove you reached it. A KPI (Key Performance Indicator) is a single metric that tracks the ongoing health of a business activity. The simplest distinction: OKRs drive change toward a new goal, while KPIs monitor performance that is already running.
OKRs and KPIs are two of the most confused terms in management, and it is easy to see why: both are about numbers, goals, and measuring success. But they answer different questions. A KPI tells you how you are doing right now. An OKR tells you where you are trying to get, and by when. Confusing the two is not a harmless vocabulary slip. When only 47 percent of employees strongly agree they know what is expected of them at work, and barely a quarter of the managers responsible for executing strategy can even name their company’s top priorities, the tools you use to set and track goals matter a great deal. This guide breaks down exactly what each one is, how they differ, real examples of both, and how the smartest teams use them together.
Key Takeaways
- KPIs measure health. A KPI is a standing metric that monitors the ongoing performance of a business activity, the “business as usual” dashboard.
- OKRs drive change. An OKR sets an ambitious objective and the key results that prove you hit it, focused effort for a quarter or a year.
- Different questions. A KPI asks “how are we doing?” An OKR asks “where are we going, and how will we know we arrived?”
- They are complementary, not competing. You do not choose one. KPIs watch the steady state; OKRs push on a chosen priority.
- A KPI can become a key result. When you decide to actively move a KPI, it often becomes the target inside an OKR for that period.
What’s in This Guide
What Is a KPI?
A Key Performance Indicator is a metric that measures how well a specific, ongoing business activity is performing against a target. The word “key” is doing real work here: a KPI is not just any number you can track, it is one of the few numbers that genuinely indicates whether an important part of the business is healthy. If a metric changing would not change a decision you make, it is not a KPI, it is just data.
KPIs are built for continuous monitoring. They run in the background, quarter after quarter, so you can spot trouble early and confirm that the core of your business is working. Good KPIs share a few traits: they are quantifiable, tied to a clear outcome, tracked over time, and owned by someone accountable for them.
Common KPIs across a business look like this:
- Monthly recurring revenue (MRR), the predictable income you can count on each month
- Customer churn rate, the percentage of customers who leave in a given period
- Average resolution time, how long it takes to close a support ticket or service request
- System uptime, the percentage of time a critical system is available
- Net Promoter Score (NPS), a standing read on customer loyalty
Notice what these have in common: none of them has an end date. You do not “finish” your churn rate. You watch it, and you want it to stay healthy indefinitely. That permanence is the defining feature of a KPI, and it is exactly what separates it from an OKR.
What Is an OKR?
OKR stands for Objectives and Key Results, a goal-setting framework with two parts. The Objective is a qualitative, memorable, slightly ambitious statement of what you want to achieve. The Key Results are three to five measurable outcomes that prove, with numbers, that you reached the objective. The objective is the inspiration; the key results are the evidence.
A single OKR looks like this:
Objective: Make our customer support the reason clients stay.
Key Result 1: Cut average first-response time from 6 hours to 1 hour.
Key Result 2: Raise customer satisfaction (CSAT) from 82 percent to 95 percent.
Key Result 3: Reduce repeat tickets on the same issue by 30 percent.
The objective is directional and easy to rally around. The key results are specific, numeric, and time-boxed, usually to a quarter or a year. When the period ends, you score the OKR, learn from it, and set the next one. Unlike a KPI, an OKR is designed to be temporary and to stretch the team beyond business as usual.
The framework is not new. Andy Grove developed OKRs at Intel in the 1970s as an evolution of Peter Drucker’s Management by Objectives, and he described the method in his 1983 book High Output Management. Investor John Doerr learned the approach directly from Grove at Intel, then introduced it to Google in 1999, when the company had roughly 30 employees. Google still runs on OKRs today, and Doerr’s 2018 book Measure What Matters carried the framework to companies far beyond Silicon Valley.
Source: What Matters: The OKR Origin Story (Andy Grove and Intel)
OKRs vs. KPIs: Side by Side
The clearest way to see the distinction is head to head. Keep in mind these are general tendencies, and a healthy organization uses both at once.
| Factor | KPI (Key Performance Indicator) | OKR (Objectives and Key Results) |
|---|---|---|
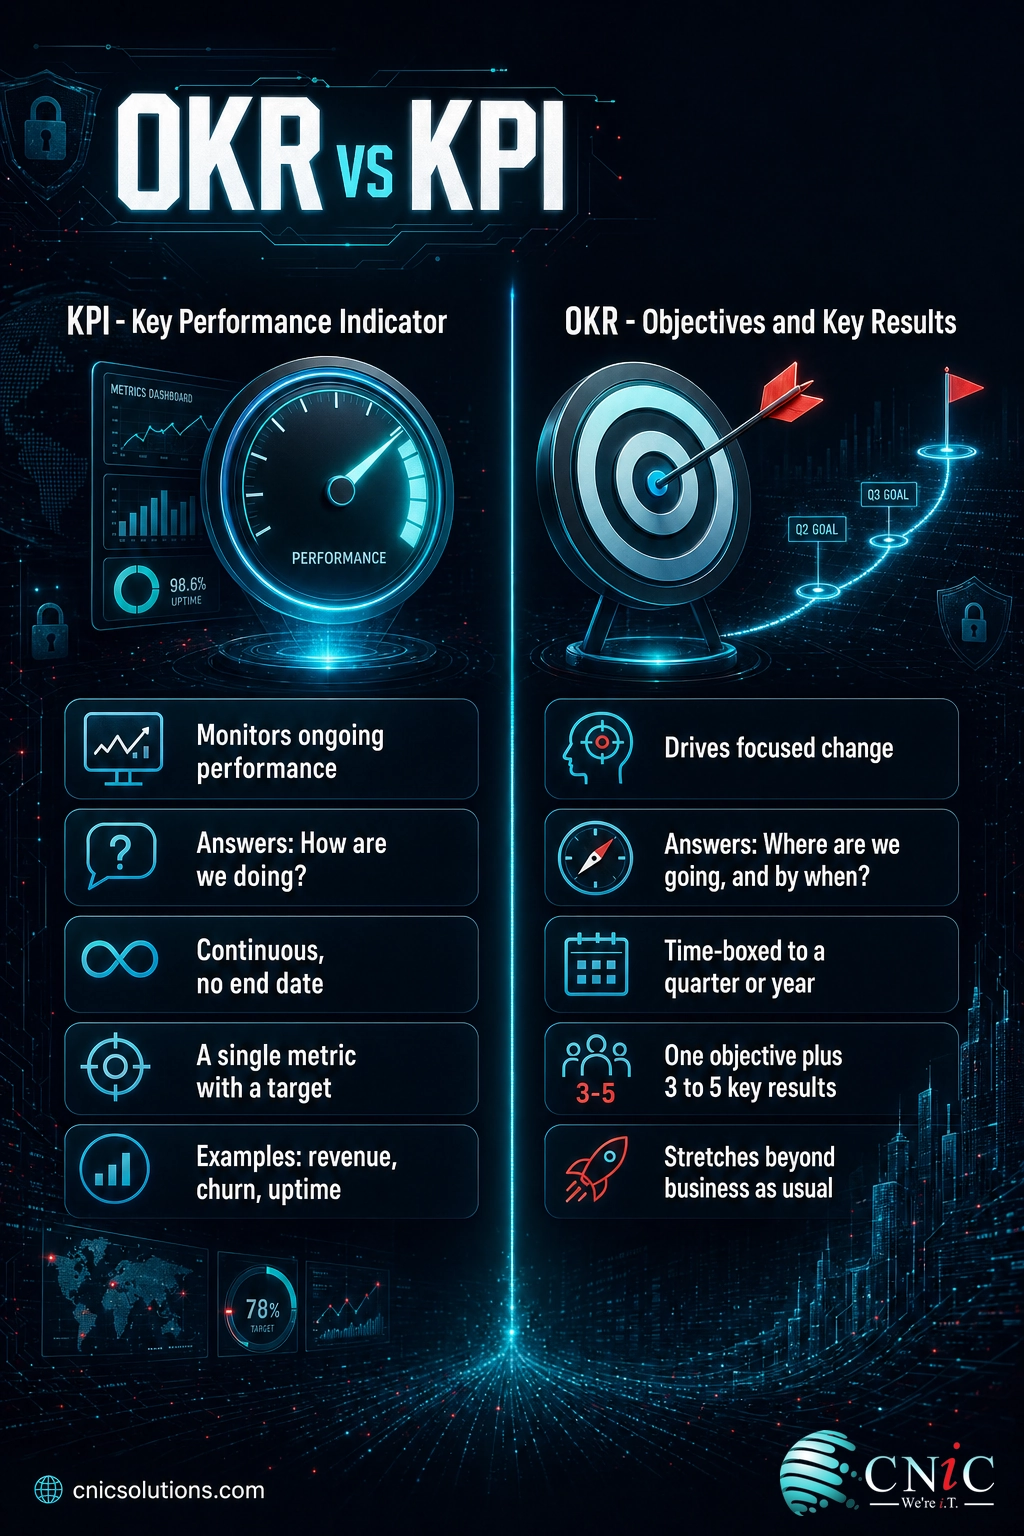
| Core purpose | Monitor ongoing performance | Drive focused change |
| Question it answers | How are we doing? | Where are we going, and by when? |
| Time frame | Continuous, no end date | Time-boxed (quarter or year) |
| Ambition level | Meet or maintain a target | Stretch beyond business as usual |
| Structure | A single metric with a target | One objective plus 3 to 5 key results |
| State it tracks | Steady state (“business as usual”) | Change and improvement |
| Best for | Operational health and early warnings | Strategic priorities and alignment |
Why the Difference Matters
This is not a semantic debate. The gap between “knowing how you are doing” and “knowing where you are going” is where most strategy quietly fails, and the data on that failure is stark.
In an analysis of 124 organizations, researchers at MIT Sloan found that only 28 percent of the executives and middle managers responsible for executing strategy could list three of their company’s strategic priorities. If the people running the plan cannot name the top three goals, no dashboard of KPIs will save them, because KPIs measure activity, not direction. That is the job OKRs exist to do.
The clarity problem shows up at the front line too. Gallup reports that only 47 percent of employees strongly agree they know what is expected of them at work, down from 56 percent just before the pandemic and 61 percent in 2015. Clarity of expectations is one of the strongest predictors of engagement Gallup measures, and it has fallen further than almost any other element.
Employees who strongly agree they know what is expected of them at work (Gallup)
Why does this matter for the OKR vs KPI question? Because the two tools solve two different halves of the problem. KPIs give you an honest, continuous read on operational health, so nothing important drifts unnoticed. OKRs translate a vague strategy into a small number of concrete, shared goals, so everyone knows what “winning this quarter” actually means. Teams that only track KPIs stay busy but rarely change direction. Teams that only set OKRs chase goals without knowing whether the core business is stable underneath them.
Myth: You have to choose between OKRs and KPIs
The most common mistake is treating OKRs and KPIs as rival systems, where adopting one means dropping the other. They are not interchangeable and they do not compete. A KPI is a metric; an OKR is a goal-setting framework that often uses metrics (sometimes your KPIs) as its key results. Ripping out your KPIs to “switch to OKRs” throws away the very dashboard that tells you whether the business is healthy. Keep your KPIs running, and layer OKRs on top for the priorities you want to actively move.
Source: MIT Sloan Management Review: No One Knows Your Strategy | Gallup Q12 Meta-Analysis

Using OKRs and KPIs Together
The best teams do not pick a side. They run KPIs and OKRs as a pair, and the relationship between them is what makes both more powerful. Here is how the two connect in practice.
KPIs monitor; OKRs mobilize. Your KPIs run continuously, giving you an early warning when a number moves the wrong way. When a KPI drifts far enough to matter, or when you simply decide a metric is not good enough, you create an OKR to fix it. The KPI is the smoke detector; the OKR is the fire drill.
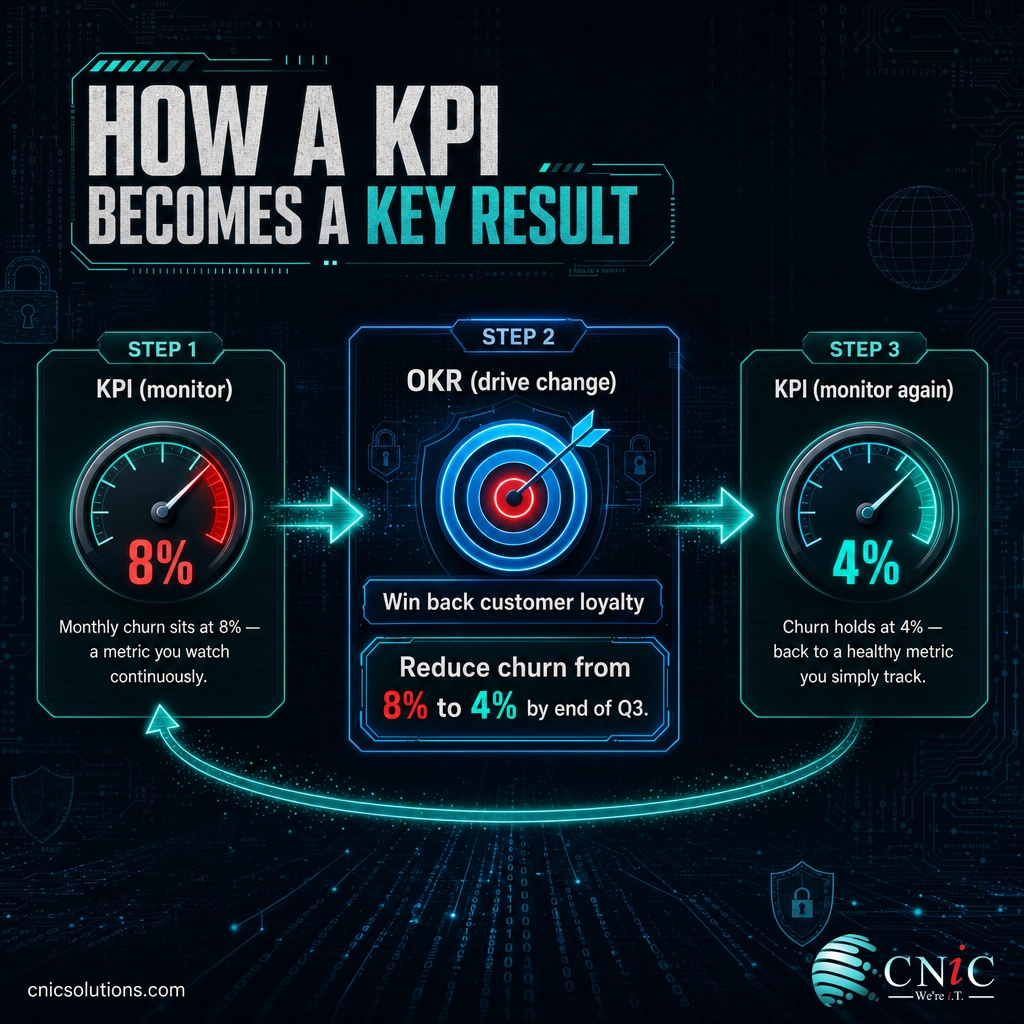
A KPI can become a key result. This is the cleanest way to see the connection. Suppose customer churn is a KPI you watch every month, and it has crept up to 8 percent. You set an OKR with the objective “Win back customer loyalty,” and one key result reads “Reduce monthly churn from 8 percent to 4 percent by the end of Q3.” For that quarter, the churn KPI becomes the measurable target inside the OKR. When the quarter ends, churn goes back to being a KPI you monitor, now at a healthier level.
OKRs need KPIs to stay honest. An objective without numbers is a slogan. KPIs supply the raw, trusted metrics that make key results credible, which is why organizations with a mature measurement culture tend to adopt OKRs more smoothly. If you already track uptime, resolution time, and satisfaction, you already have the ingredients for meaningful key results.
For a technology-driven example, imagine a business whose IT has been unreliable. The standing KPIs might be system uptime and average ticket resolution time. The quarterly OKR built on top could be:
Objective: Make our technology something the team never has to think about.
Key Result 1: Raise system uptime from 99.2 percent to 99.9 percent.
Key Result 2: Cut average ticket resolution time from 9 hours to 3 hours.
Key Result 3: Reduce recurring incidents by 40 percent.
Getting to that level of reliability is often less about buying more technology and more about having someone accountable for the strategy behind it, which is where fractional IT leadership and day-to-day managed IT support come in for businesses without a full in-house team.
How to Put OKRs and KPIs to Work
You do not need a consultant or a software platform to start. You need clarity and discipline. A practical sequence:
- Start with your KPIs. List the handful of metrics that genuinely indicate whether each core part of your business is healthy. If you have more than about seven per team, you are tracking data, not KPIs. Cut the list down.
- Pick one or two priorities to actually move. Look at where a KPI is unhealthy, or where strategy demands a change, and choose no more than a couple of objectives per team. Focus is the whole point; a team with ten objectives has none.
- Write measurable key results. Each objective gets three to five key results with a clear starting number and a target number. “Improve customer satisfaction” is not a key result. “Raise CSAT from 82 to 95 percent” is.
- Set the cadence. Review KPIs continuously (weekly or monthly) and score OKRs at the end of each quarter. Separate the two rhythms so operational monitoring never crowds out strategic reflection.
- Make ownership explicit. Every KPI and every key result needs a name attached. Shared accountability is often no accountability.
The hardest part is usually not the mechanics, it is the strategic judgment about which metrics matter and which goals are worth the organization’s focus this quarter. That is precisely the gap the MIT Sloan and Gallup data expose: leaders are busy, but priorities are unclear. For small and midsize businesses that feel this on the technology side but cannot justify a full-time executive, a fractional technology leader can set the KPIs, frame the OKRs, and hold the roadmap accountable. It is the same reasoning behind how technology leadership roles are structured as a business grows.
See how a Virtual CIO turns IT strategy into measurable results
Whether you use OKRs, KPIs, or both, the goal is the same: replace vague intentions with clear, measured direction. KPIs keep you honest about today. OKRs keep you moving toward tomorrow. Used together, they turn a strategy that lives in a slide deck into work your whole team can actually see and steer.
Explore more business management and IT strategy resources
Frequently Asked Questions
What is the difference between an OKR and a KPI?
What are examples of OKRs vs KPIs?
Can a KPI become a key result in an OKR?
Do OKRs replace KPIs?
Where did OKRs come from?
About This Guide and Sources
The definitions of OKRs and KPIs in this guide reflect the framework as developed by Andy Grove at Intel and popularized by John Doerr, and the standard distinction between goal-setting frameworks and performance metrics used across management literature. The illustrative OKR and KPI examples (support response times, churn, uptime, satisfaction targets) are hypothetical and provided for clarity, not drawn from a specific company. Statistics on strategic clarity are from MIT Sloan Management Review’s analysis of 124 organizations (Sull, Sull, and Yoder), and statistics on clarity of expectations and engagement outcomes are from Gallup, including the Gallup Q12 meta-analysis.
Sources: What Matters: The OKR Origin Story; MIT Sloan Management Review: No One Knows Your Strategy; Gallup Q12 Meta-Analysis.



related posts
Password Statistics for 2026: Reuse, Cracks, and the Passkey Shift
September 22, 2026Weak and stolen passwords are still the number one way attackers get in. In 2025, stolen…
Mobile Security Software for Business: A Buyer’s Guide
September 21, 2026Choosing mobile security software for business comes down to two decisions: how you will manage the…
15 Microsoft Teams Tips and Tricks to Boost Team Productivity
September 21, 2026Microsoft Teams is where most of the workday now happens: it passed 320 million monthly active…
McAfee Scam Emails: How to Spot Fake Renewal Notices
September 20, 2026A fake McAfee renewal email is one of the most common scams landing in business inboxes…