
Cyber insurance has become one of the fastest-growing — and most misunderstood — financial products in the business world. The global market hit $15.3 billion in 2024. U.S. premiums declined for the first time in history that same year. Claims frequency jumped 40%. And yet more than half of eligible organizations worldwide still have no policy at all. Meanwhile, the businesses that do carry coverage are discovering that policies contain exclusions, underwriting requirements, and security control mandates they didn’t fully anticipate. This article compiles the definitive cyber insurance statistics for 2026 drawn from Tier 1 primary sources — NAIC, Munich Re, AM Best, Aon, Coalition, and the FBI IC3 — covering market size, premium trends, claims data, adoption gaps, and what insurers now require to be covered at all.
Key Takeaways: Cyber Insurance Statistics 2026
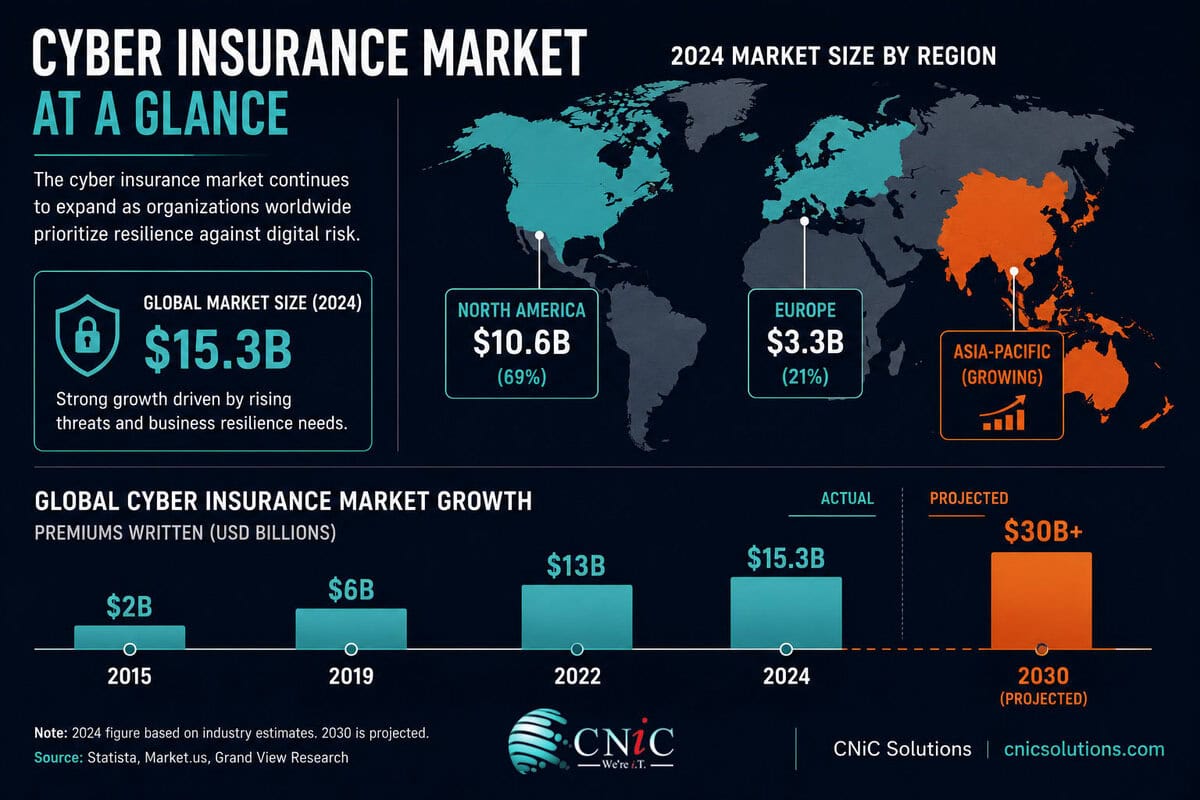
- The global cyber insurance market reached $15.3 billion in 2024 — less than 1% of the total global property and casualty insurance market, signaling massive untapped potential (Munich Re 2025).
- U.S. premiums declined for the first time ever in 2024 — down 7% to $9.14 billion — driven by market softening, not reduced demand (NAIC 2025 Cybersecurity Insurance Report).
- Claims frequency jumped nearly 40% in 2024 with nearly 50,000 U.S. claims reported, even as premiums fell (NAIC 2025).
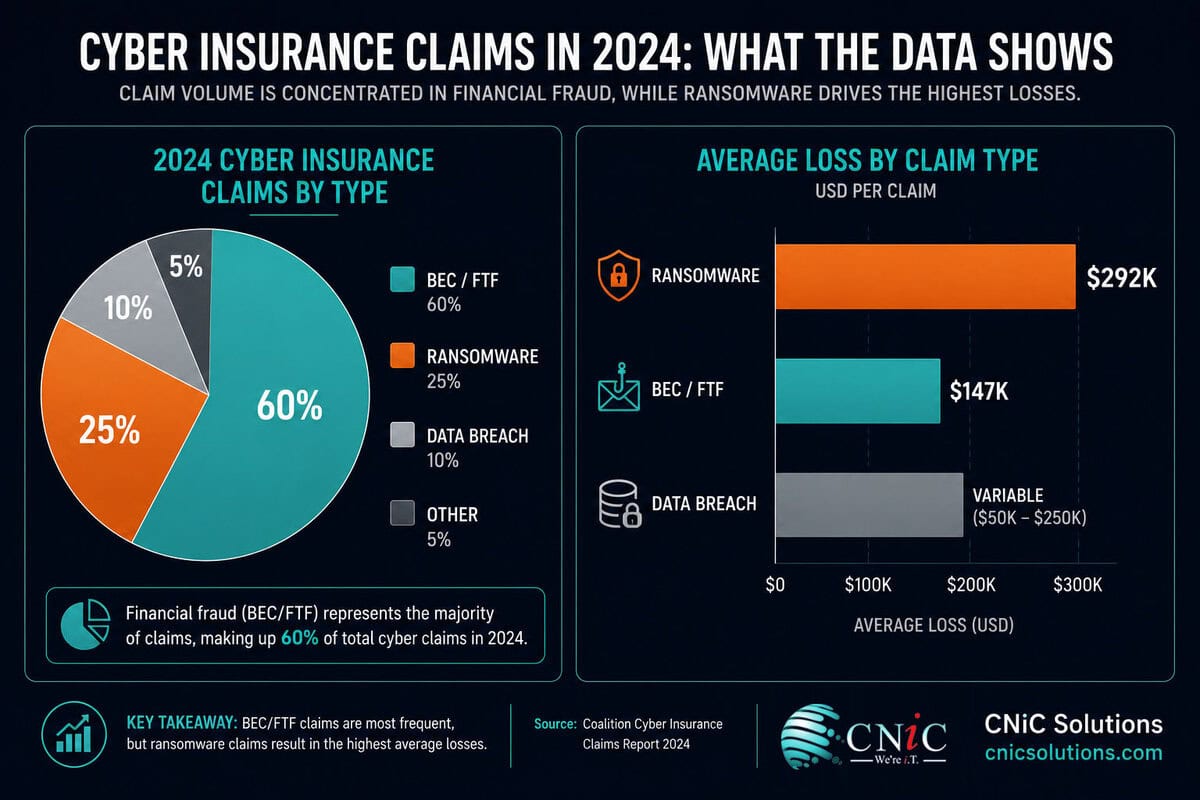
- 60% of all 2024 cyber insurance claims originated from Business Email Compromise and Funds Transfer Fraud — not ransomware (Coalition 2025 Cyber Claims Report).
- Only 47% of eligible organizations globally have a cyber insurance policy — the “cyber protection gap” leaves the majority of businesses financially exposed (Munich Re 2025).
- 27% of data breach claims involved policy exclusions that resulted in non-payment or partial payment (Astra Security research).
- Coalition policyholders experience 73% fewer claims than the industry average — demonstrating the measurable value of active cyber risk management paired with insurance (Coalition 2025).
Global Cyber Insurance Market Size and Growth (2024–2030)
The cyber insurance market has grown from a niche product to a multi-billion dollar global industry in under a decade. Understanding its current scale — and where it’s headed — is essential context for any organization evaluating whether to carry coverage and how much.
Munich Re’s 2025 Cyber Insurance Risks and Trends report — the most authoritative annual assessment of the global market — confirmed total 2024 premiums of $15.3 billion, with an expectation of reaching $16.3 billion by end of 2025. The market’s geographic distribution is heavily concentrated: North America accounts for 69% of global premiums ($10.6 billion), Europe 21% ($3.3 billion), with Asia-Pacific and Latin America representing high-growth but currently underpenetrated frontiers.
Global Cyber Insurance Market Growth (Munich Re / NAIC / QualRisk)
Despite impressive absolute numbers, the market’s size relative to total global insurance premiums reveals a significant structural gap. Cyber insurance represents less than 1% of global property and casualty premiums — a figure Munich Re describes as both a missed opportunity for insurers and a “dangerous lack of financial resilience in the global economy.” The gap between actual and potential market size is massive, driven by four primary barriers: the perceived cost of coverage, lack of product awareness, limited policy understanding among buyers, and insufficient scope of coverage relative to organizational risk appetite.
Munich Re estimates only 47% of eligible organizations globally carry cyber insurance. IBM’s 2025 Cost of a Data Breach Report puts the average breach cost at $4.88 million. Applying that coverage gap to the U.S. business landscape — where approximately 33.2 million businesses operate — and assuming even a conservative 1% annual breach probability for uninsured organizations suggests over $860 billion in uninsured cyber exposure sits in the U.S. economy alone, based on unprotected businesses facing average breach costs with no insurance recovery mechanism. The “protection gap” isn’t an abstract insurance concept — it’s a systemic economic vulnerability.
CNiC-derived estimate: 33.2M U.S. businesses × 53% uninsured × 1% breach probability × $4.88M average breach cost. Sources: Munich Re 2025, IBM Cost of Breach 2025, U.S. SBA business count data. Calculation and interpretation original to CNiC Solutions.
Source: Munich Re Cyber Insurance Risks and Trends 2025 | QualRisk Cyber Insurance Center 2025 Global Market Report
Explore CNiC’s Cybersecurity Services for Houston Businesses →
U.S. Cyber Insurance Premium Trends: The First Decline in History
2024 marked a historic inflection point for the U.S. cyber insurance market — the first-ever annual decline in direct written premiums since the NAIC began tracking the data in 2015. Understanding what drove this reversal, and what it means for buyers, requires looking beyond the headline number.
The NAIC’s 2025 Cybersecurity Insurance Report — drawing on direct filings from all U.S.-domiciled cyber insurers — confirmed U.S. direct written premiums fell from $9.84 billion in 2023 to $9.14 billion in 2024. AM Best’s parallel analysis found U.S.-domiciled insurer DWP declined 2.3% to $7.08 billion. The discrepancy reflects different scope definitions (NAIC includes alien surplus lines carriers; AM Best’s analysis focuses on domiciled insurers only).
Critically, AM Best attributed the decline primarily to falling pricing rather than reduced demand. The Council of Insurance Agents and Brokers (CIAB) data showed cyber pricing decreased an average of 1.6% during the final three quarters of 2024, closely matching the overall premium decline — suggesting demand held steady while the hard market cycle continued to unwind. Coalition’s market outlook projected further decreases of 5-7% in 2025, while noting that a large-scale systemic cyber event could rapidly reverse pricing trends.
| Year | U.S. DWP (Total incl. surplus lines) | YoY Change | Market Context |
|---|---|---|---|
| 2020 | ~$3.0B | — | Pre-hard market |
| 2021 | ~$4.8B | +60% | Hard market begins; ransomware surge |
| 2022 | ~$7.2B | +50% | Peak rate increases (+50–100%) |
| 2023 | $9.84B | +1.6% | Market softening begins |
| 2024 | $9.14B | −7% | First-ever annual decline (NAIC) |
| 2025 (projected) | ~$8.5–9.0B | −5% to −7% | Continued softening (Coalition) |
Source: NAIC 2025 Cybersecurity Insurance Report | Aon 2024 U.S. Cyber Market Update | American Academy of Actuaries: Cyber Insurance Inflection Point, 2026
Get Expert Cyber Insurance Guidance from CNiC’s vCIO Team →
Cyber Insurance Claims Statistics: What’s Actually Being Filed
Premium trends tell you what the market costs. Claims data tells you what’s actually happening to organizations when incidents occur. The 2024–2025 claims landscape reveals a market where frequency is rising, BEC dominates by volume, and ransomware dominates by severity.
Coalition’s 2025 Cyber Claims Report — based on actual policyholder claims data — provides the most granular public view of what cyber claims look like in practice. The headline finding: 60% of all 2024 claims originated from Business Email Compromise and Funds Transfer Fraud, with 29% of BEC events resulting in fraudulent fund transfers. Ransomware, while accounting for a smaller share of claim count, remains the most costly and disruptive single event type. Global claims frequency decreased 7% year-over-year for Coalition policyholders — demonstrating the measurable value of the active risk management approach that pairs security controls with insurance coverage.
| Claim Type | Share of Claims (Volume) | Average Loss | Key Detail |
|---|---|---|---|
| BEC / Funds Transfer Fraud | 60% combined | Varies; $50K median per FBI | 29% of BEC events result in FTF |
| Ransomware | 41% of claims by volume | $292,000 avg (2025) | Most costly; most disruptive |
| Data Breach | Significant share | $4.88M avg total (IBM) | 27% involve coverage exclusions |
| Business Interruption | Major cost driver | $297K+ in extended cases | CrowdStrike, Change Healthcare drove 2024 BI claims |
| First-party claims overall | 75% of all claims | — | Internal losses dominate claim volume |
The 2024 claims environment was significantly shaped by large-scale systemic events. The CrowdStrike outage in July 2024 — a faulty software update causing widespread Windows system failures globally — generated a wave of business interruption claims not caused by a cyberattack at all, but falling within many policies’ system failure coverage. Change Healthcare’s ransomware attack generated $22 million in ransom payment plus an estimated $2.4 billion in total business impact for UnitedHealth Group. CDK Global’s ransomware attack disrupted auto dealerships nationwide. These three events alone underscored both the value of cyber insurance and the complexity of what policies actually cover.
Aon’s analysis of its U.S. broking clients found that the average ransom payment dropped 77% in 2024, directly attributable to improved backup strategies, stronger incident response plans, and professional negotiators engaged through insurance policies. Coalition confirmed that when ransom was deemed necessary, its incident response team negotiated an average 60% reduction from initial demands.
Source: Coalition 2025 Cyber Claims Report | NAIC 2025 Cybersecurity Insurance Report
Build the Backup Strategy Insurers Now Require →
Cyber Insurance Adoption Rates: Who Has It and Who Doesn’t
The single most important cyber insurance statistic for most businesses is also the most uncomfortable: the majority of organizations that need coverage don’t have it. The “cyber protection gap” — the difference between insured and uninsured cyber exposure — represents one of the largest unaddressed financial risks in the global economy.
Adoption rates reveal a stark divide by organization size. Large enterprises have reached near-saturation in many sectors — healthcare leads at 82% adoption among large institutions, with financial services and technology close behind. The gap widens dramatically at the SMB level. Munich Re identifies SMBs as bearing the greatest uninsured cyber risk globally, driven by a combination of factors: the assumption that small businesses aren’t targeted (demonstrably false — Verizon’s 2025 DBIR found ransomware appeared in 88% of SMB breaches versus 39% for large organizations), pricing concerns, and a lack of understanding about what coverage actually includes.
U.S. Cyber Insurance Adoption Rate by Organization Size
Texas specifically warrants attention. The NAIC data shows Texas accounts for 9.70% of total U.S. cyber insurance direct written premiums — the fourth-largest state market behind Delaware (17.69%), Illinois (15.63%), and Connecticut (12.91%). For Houston-area businesses operating in energy, healthcare, manufacturing, and professional services, the state’s elevated threat profile and significant premium concentration reflect both the risk exposure and the growing recognition of insurance as a necessary component of risk management.
The number of active U.S. policies in force was essentially flat in 2024 at 4,368,614 — a significant change from the 11.7% growth seen in 2023. This plateau suggests the market is approaching saturation among organizations that actively seek coverage, while the majority of uninsured organizations remain unengaged. Policy count growth will likely require either significant premium reductions (which are occurring), better SMB education, or regulatory mandates pushing coverage adoption.
Source: Munich Re Cyber Insurance Risks and Trends 2025 | NAIC 2025 Cybersecurity Insurance Report
Learn How Managed IT Makes Your Business More Insurable →
What Cyber Insurers Now Require: The Security Control Baseline
The era of getting cyber insurance by answering a questionnaire is over. Underwriters have moved to technical verification of actual security controls, and the list of requirements has expanded substantially from what was expected in 2020. Understanding these requirements matters not just for getting covered — it matters because organizations that don’t meet them face claim denial after an incident, regardless of whether they hold a policy.
Modern cyber insurance underwriting requires demonstrable evidence of the following controls — not just attestation that they exist:
| Required Control | Insurer Rationale | Coverage Impact if Missing |
|---|---|---|
| Multi-Factor Authentication (MFA) — all users | 80% of ransomware attacks originate from compromised remote access; MFA blocks credential-based attacks | Denial of coverage or ransomware exclusion |
| Phishing-resistant MFA (advanced) | Standard MFA bypassed by AiTM attacks (+146% in 2024) | Premium surcharge; coverage gap for AiTM losses |
| Immutable, air-gapped backups | 72% of ransomware attacks target backups; isolated backups enable recovery without paying | Ransomware sublimit or exclusion |
| 24/7 EDR with active response | Unmonitored endpoints are primary lateral movement pathway | Coverage denial for unmonitored endpoint incidents |
| Documented, tested Incident Response plan | IR readiness directly controls claim severity and duration | Premium surcharge; reduced coverage limits |
| Email security with BEC detection | 60% of claims are BEC/FTF; email is primary attack vector | BEC/FTF sublimits or exclusions |
| Third-party vendor risk management | 30% of breaches now involve third parties (Verizon DBIR 2025) | Supply chain exclusions |
| Patch management with documented cadence | Unpatched systems are primary vulnerability exploitation pathway | Exclusion for attacks via known unpatched CVEs |
Healthcare and financial services organizations consistently face premiums 50% higher than the market average due to their combination of high breach cost, high attack frequency, and high data sensitivity. Ransomware-specific coverage saw the steepest premium increases during the 2021–2022 hard market (45%+ year-over-year in some policies) and remains the coverage component with the most complex exclusion language.
Businesses that cannot demonstrate the controls above face three outcomes at underwriting: outright denial of coverage, exclusion of specific incident types (particularly ransomware), or — most dangerously — coverage in force that will be denied at claim time due to a material misrepresentation about security posture. The third scenario is the most costly: an organization pays premiums, believes it is covered, suffers an incident, and then discovers the claim is denied because security controls required at policy inception were not maintained.
Source: Coalition 2025 Cyber Claims Report | IRONSCALES Cyber Insurance in 2026 Analysis
See How CNiC Helps Businesses Meet Insurer Security Requirements →
Cyber Insurance Loss Ratios and Market Profitability
The financial health of the cyber insurance market — measured primarily through loss ratios — determines how long the current favorable pricing environment lasts, what exclusions insurers impose, and whether capacity continues to flow into the sector. For buyers, understanding loss ratios provides critical insight into the sustainability of current coverage terms.
A loss ratio below 60-70% is generally considered profitable for insurers. The U.S. cyber insurance market has maintained loss ratios in the 40-50% range from 2022 through 2024 — a remarkable improvement from the unsustainable levels of 2020 (France briefly saw ratios above 160%) driven by the ransomware surge of 2019-2021. The 2024 ratio of 49% — slightly higher than 2022-2023 — reflects the claims frequency increase and three major systemic events (CrowdStrike outage, Change Healthcare, CDK Global) that generated outsized losses in an otherwise stable year.
U.S. Cyber Insurance Loss Ratio Trend
Beazley — one of the leading and most transparent cyber insurers — reported a 48.5% loss ratio through the first half of 2025, with a negative 6.8% rate change, indicating premiums continued declining even as the loss environment remained stable. The top 5 U.S. cyber insurers’ market concentration continued to decline, falling from 48% in 2020 to approximately 30% in 2024 — a healthy competitive dynamic that benefits buyers through increased choice and price competition.
The systemic risk debate has intensified following 2024’s large-scale events. The CrowdStrike outage demonstrated that a single technology vendor update could trigger simultaneous claims across thousands of policyholders worldwide — a correlated loss scenario that challenges traditional insurance diversification models. Reinsurers remain cautious about systemic cyber risk, and approximately 50% of cyber premiums are ceded to reinsurers. A major systemic event — a widespread cloud provider outage, a critical infrastructure attack, or a software supply chain compromise — could rapidly harden the market and reverse current pricing trends.
Source: American Academy of Actuaries: Cyber Insurance Inflection Point, February 2026 | AM Best U.S. Cyber Market Segment Report 2025
Reduce Your Cyber Risk Profile with CNiC Infrastructure Management →
Cyber Insurance Statistics Summary (2026 Reference Table)
| Statistic | Data Point | Source | Year |
|---|---|---|---|
| Global cyber insurance market (total premiums) | $15.3 billion | Munich Re 2025 | 2024 |
| Projected global market by 2030 | $27–30B+ (10%+ CAGR) | Munich Re / QualRisk 2025 | 2030 projection |
| Cyber as % of global P&C insurance | <1% | Munich Re 2025 | 2024 |
| North America market share | $10.6B / 69% of global | Munich Re 2025 | 2024 |
| Europe market share | $3.3B / 21% (26% CAGR 2020–2024) | Munich Re 2025 | 2024 |
| U.S. direct written premiums (total) | $9.14B (−7% YoY, first-ever decline) | NAIC 2025 Cybersecurity Insurance Report | 2024 |
| U.S. domiciled insurer DWP | $7.08B (−2.3%) | AM Best / Aon 2025 | 2024 |
| U.S. policies in force | 4,368,614 (flat, +0.03%) | NAIC 2025 | 2024 |
| U.S. claims reported | ~50,000 (+40% YoY) | NAIC 2025 | 2024 |
| U.S. rate change Q4 2024 | −5% (first quarterly decrease in 7 years) | NAIC / Aon | Q4 2024 |
| U.S. loss ratio | 49% | Actuary.org / Aon 2025 | 2024 |
| U.S. active cyber insurers | 218 | NAIC / AM Best 2025 | 2024 |
| Texas market share (U.S.) | 9.70% of U.S. DWP | NAIC 2025 | 2024 |
| Claims from BEC/FTF | 60% of all claims | Coalition 2025 Cyber Claims Report | 2024 |
| Average claim loss amount | $115,000 | Coalition 2025 Cyber Claims Report | 2024 |
| Ransomware avg loss per insured incident | $292,000 (2025) | Industry research | 2025 |
| Coalition ransom negotiation reduction | 60% avg reduction from initial demand | Coalition 2025 | 2024 |
| Aon client ransom payment reduction | −77% average in 2024 | Aon / NAIC 2025 | 2024 |
| Coalition policyholders: fewer claims | 73% fewer than industry avg | Coalition 2025 | 2024 |
| Global adoption rate (eligible orgs) | 47% have a policy | Munich Re 2025 | 2024 |
| Large U.S. corporations: adoption | 76% | NAIC / market research | 2023–2024 |
| Small business adoption | 47% | Munich Re / market research | 2024 |
| Healthcare adoption (large) | 82% | Market research | 2023 |
| Claims with exclusion/partial payment | 27% of data breach claims | Astra Security research | 2024 |
| Ransomware attacks targeting backups | 72% of incidents | Industry research | 2024 |
| Cyber ROI on insurance (Howden est.) | 19% ROI for businesses that claim | Howden 2025 | 2025 |
| Reinsurance cession rate | ~50% of premiums ceded to reinsurers | NAIC / AM Best 2025 | 2024 |
Frequently Asked Questions: Cyber Insurance
Methodology & Sources
All statistics in this article are sourced directly from Tier 1 primary sources: government regulatory filings, actuarial organizations, and organizations that collect raw market or claims data. No blog-to-blog citations were used as primary references. CNiC-derived calculations are clearly labeled with formulas and source attribution.
Primary Sources Referenced:
- NAIC 2025 Cybersecurity Insurance Report — National Association of Insurance Commissioners annual compilation of U.S. cyber insurance market data from all domestic filings. naic.org
- Munich Re Cyber Insurance Risks and Trends 2025 — Annual global cyber insurance market assessment from one of the world’s leading reinsurers. munichre.com
- AM Best U.S. Cyber Market Segment Report 2025 — Credit rating agency analysis of U.S. cyber insurance market performance and loss ratios.
- Aon 2024 U.S. Cyber Market Update — Broker analysis of U.S. cyber insurance pricing, premiums, and claims trends based on NAIC data. aon.com
- Coalition 2025 Cyber Claims Report — Actual policyholder claims data from a leading cyber insurer covering full-year 2024. coalitioninc.com
- American Academy of Actuaries: Cyber Insurance Nears an Inflection Point (2026) — Actuarial analysis of U.S. market trends, loss ratios, and future outlook. actuary.org
- QualRisk Cyber Insurance Center 2025 Global Market Report — Global cyber insurance market projections and regional growth analysis.
- IBM Cost of a Data Breach Report 2025 — Breach cost data used in protection gap analysis.
- Verizon 2025 Data Breach Investigations Report (DBIR) — SMB vs. enterprise breach data and ransomware involvement statistics.
- FBI IC3 2024 Annual Report — BEC and cybercrime loss data providing claims context.
This article was researched and published by CNiC Solutions, a Houston-based managed IT and cybersecurity provider. Content is updated as new primary source data becomes available. Last updated: May 2026.

related posts
Cloud Security Statistics 2026: Breaches, Misconfigurations, Costs & Market Data
May 17, 2026The cloud is now where most enterprise data lives — and increasingly, where most breaches happen.…
Cybersecurity Compliance Statistics 2026: GDPR, HIPAA, PCI DSS & CMMC Data
May 16, 2026Cybersecurity compliance is no longer a back-office checklist — it is a board-level financial risk with…
Ransomware Recovery Statistics 2026: Timelines, Costs, & Backup Data
May 16, 2026When ransomware hits, how you recover matters as much as whether you were attacked. The gap…
Data Breach Statistics 2026: Frequency, Causes, Industries & Global Trends
May 16, 2026Data breaches in 2024 didn't break the record — but they broke something arguably more alarming.…