

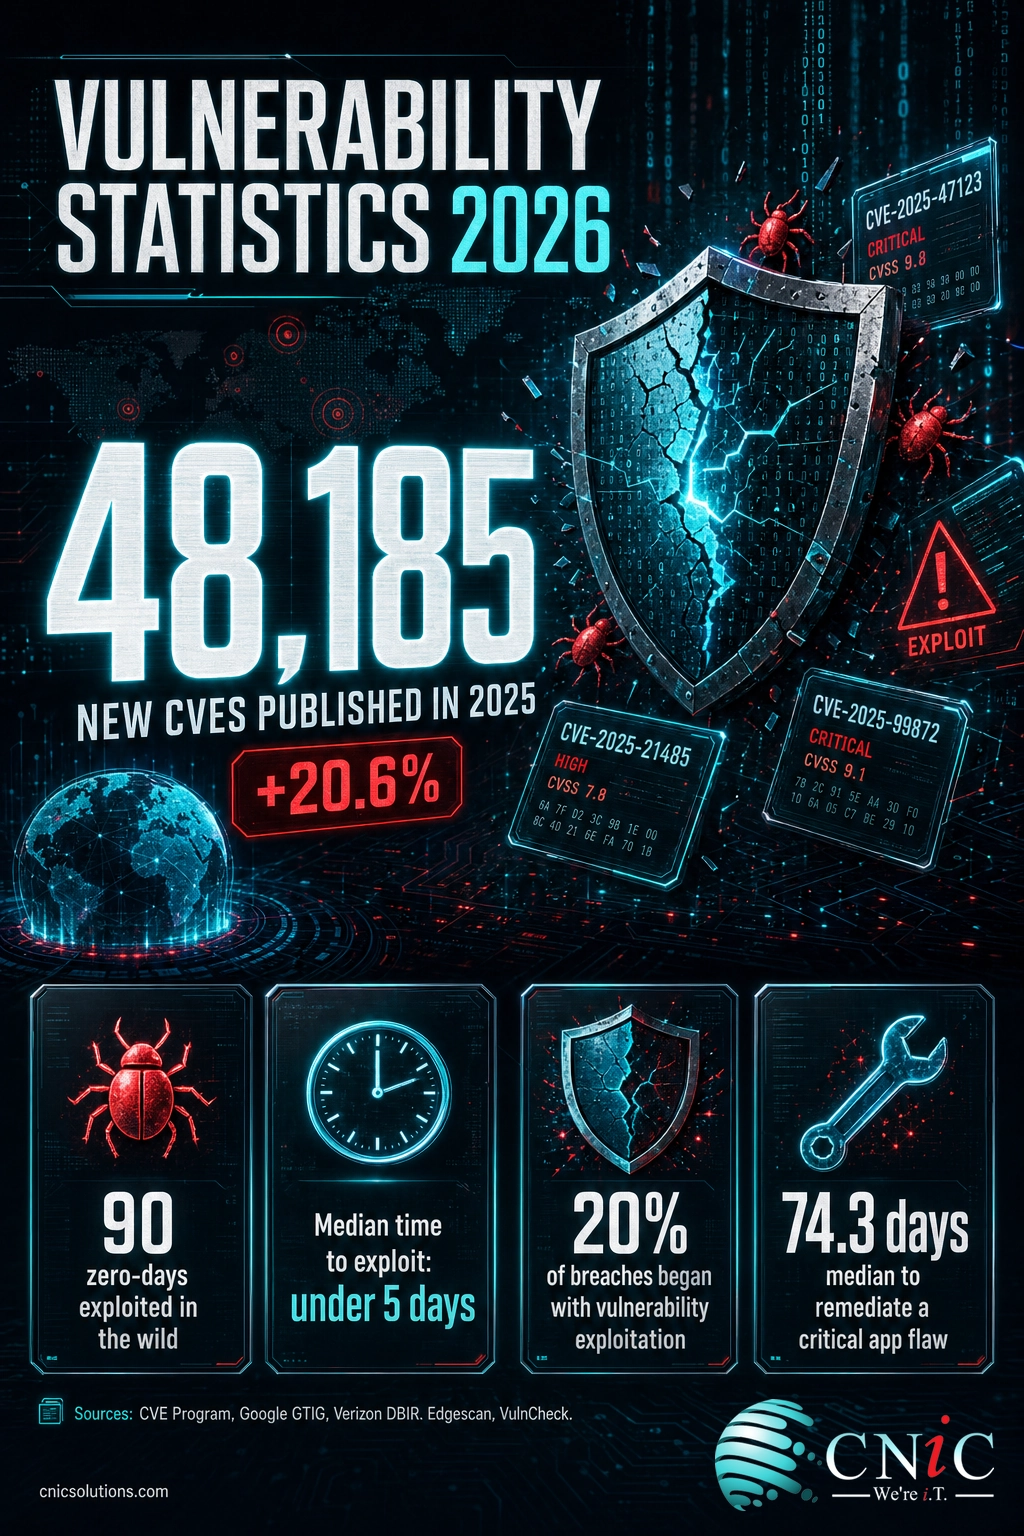
In 2025 the world disclosed a record 48,185 software vulnerabilities, attackers weaponized 90 zero-days, and the median time to exploit a new flaw fell to under five days. The problem for most businesses is not a shortage of patches. It is that the average critical, internet-facing vulnerability still takes more than 70 days to fix, and attackers only need one.
- Record disclosure: 48,185 CVEs were published in 2025, up 20.6% year over year, about 131 new vulnerabilities every day (CVE Program).
- Exploitation is now a top entry point: vulnerability exploitation drove 20% of breaches, up 34%, and was the #1 initial infection vector at 33% on the incident-response frontline (Verizon DBIR, Mandiant M-Trends).
- Zero-days shifted to the enterprise: 90 zero-days were exploited in 2025, and 48% targeted enterprise software and appliances, the highest enterprise share on record (Google GTIG).
- Exploit speed beats patch speed: median time to exploit is under 5 days and 28.96% of newly exploited flaws were hit on or before their CVE was published, while critical app vulnerabilities take a median 74.3 days to remediate (VulnCheck, Edgescan).
- Edge devices are the new front line: 22% of exploitation breaches hit firewalls, VPNs, and gateways, an eightfold jump, and only 54% of vulnerable edge devices were fully patched in the observed window (Verizon DBIR).
- Volume is a distraction: a tiny share of all CVEs are ever exploited, so prioritizing known-exploited and internet-facing flaws matters far more than patch counts.
What’s in This Report
- Vulnerability Disclosure Hit a Record in 2025
- Which Vulnerabilities Attackers Actually Exploit
- Zero-Days: 90 Exploited, Enterprise in the Crosshairs
- Time to Exploit vs Time to Remediate
- Edge Devices, VPNs, and the Attack Surface
- What This Means for Small and Midsize Businesses
- Summary Table: Every Stat at a Glance
- Frequently Asked Questions
- Methodology and Sources
1Vulnerability Disclosure Hit a Record in 2025
The raw number of catalogued vulnerabilities keeps setting records. The CVE Program, the global system that assigns a unique identifier to every publicly known flaw, published 48,185 new CVEs in 2025. That is a 20.6% increase over 2024 and the largest annual total ever recorded, averaging roughly 131 new vulnerabilities every single day.
New CVEs Published Per Year, 2021 to 2025
Annual totals vary slightly by data source. Source: CVE Program (cve.org).
It is tempting to read that curve as pure bad news, and the growth is real: more software, more dependencies, and more researchers all push the count up. But the total number of disclosed vulnerabilities is a poor measure of risk on its own. Most CVEs are never weaponized. The vulnerabilities that hurt businesses are the small subset that attackers actually pick up and use, which is exactly what the exploitation data measures.
Myth: “We need to patch every CVE to be safe.” No organization can patch 48,000 vulnerabilities a year, and trying to treats a same-day-exploited firewall flaw and an obscure, never-exploited library bug as equal. Fewer than a few percent of published CVEs are ever confirmed exploited. The goal is not zero open vulnerabilities. It is zero open vulnerabilities that attackers are actually using, prioritized by exploitation evidence and exposure.
Source: CVE Program metrics (cve.org) | NIST National Vulnerability Database
Turning that firehose of disclosures into a short, ranked list of what to fix first is the core of vulnerability management, and it is one of the first strategic decisions a business has to get right.
2Which Vulnerabilities Attackers Actually Exploit
Two of the most respected data sets in the industry, Verizon’s Data Breach Investigations Report and Mandiant’s M-Trends, both point to the same conclusion for 2025: exploiting a known vulnerability has become one of the primary ways attackers get in. Verizon found that vulnerability exploitation was the initial access vector in 20% of breaches, a 34% year-over-year increase, making it the second most common entry point behind stolen credentials.
Mandiant’s frontline view is the sharpest. Across its 2024 investigations, exploits were the most common initial infection vector at 33%, with stolen credentials second at 16% and prior compromise through access brokers at 8%. Exploits and stolen credentials alone account for 49% of intrusions, tracing back to either an unpatched vulnerability or a compromised credential, the two problems a disciplined security program is built to close.
Most Common Initial Infection Vectors, Mandiant M-Trends 2025
Exploits have been the leading initial vector for multiple years running. Source: Mandiant M-Trends 2025.
Counting how many vulnerabilities are exploited is its own discipline. VulnCheck, which maintains one of the most comprehensive exploited-vulnerability data sets, recorded 884 vulnerabilities with first-time exploitation evidence in 2025, a 15% increase over the prior year. CISA’s public Known Exploited Vulnerabilities catalog, the authoritative U.S. government list of flaws confirmed to be exploited, added 245 entries in 2025 and has grown to more than 1,400 vulnerabilities overall. Both lists exist for one reason: to tell defenders which of the tens of thousands of CVEs are worth acting on first.
Why the “known exploited” lists matter. CISA’s KEV catalog and VulnCheck’s exploited-vulnerability data turn 48,000 theoretical risks into a working priority queue of a few hundred flaws that are provably being used in attacks. A vulnerability on one of these lists deserves emergency treatment regardless of its CVSS score. A high-CVSS flaw with no exploitation evidence and no internet exposure often does not.
Source: Verizon 2025 Data Breach Investigations Report | Mandiant M-Trends 2025 | CISA Known Exploited Vulnerabilities catalog
Closing the exploit and credential gap is the core of day-to-day security operations, from monitoring to rapid remediation.
Explore CNiC Cybersecurity Services
3Zero-Days: 90 Exploited, Enterprise in the Crosshairs
A zero-day is a vulnerability that attackers exploit before the vendor has a patch available, which leaves defenders with no fix to apply at the moment of attack. Google’s Threat Intelligence Group, which publishes the most rigorous public zero-day tracking, counted 90 zero-day vulnerabilities exploited in the wild in 2025. That is up roughly 15% from 78 in 2024, though still below the record of about 100 tracked in 2023.
The headline is not the count, it is the shift in target. For years, zero-day exploitation concentrated on consumer technology: browsers and phones. In 2025 that inverted. Nearly half of all zero-days aimed at enterprise-grade software and security appliances, and browser zero-days fell to just eight. Attackers have learned that a single flaw in a firewall, VPN gateway, or management console can unlock an entire network, and those devices often sit unpatched at the edge with little monitoring.
Zero-Days Exploited in the Wild Per Year
Source: Google Threat Intelligence Group zero-day tracking, 2022 to 2025.
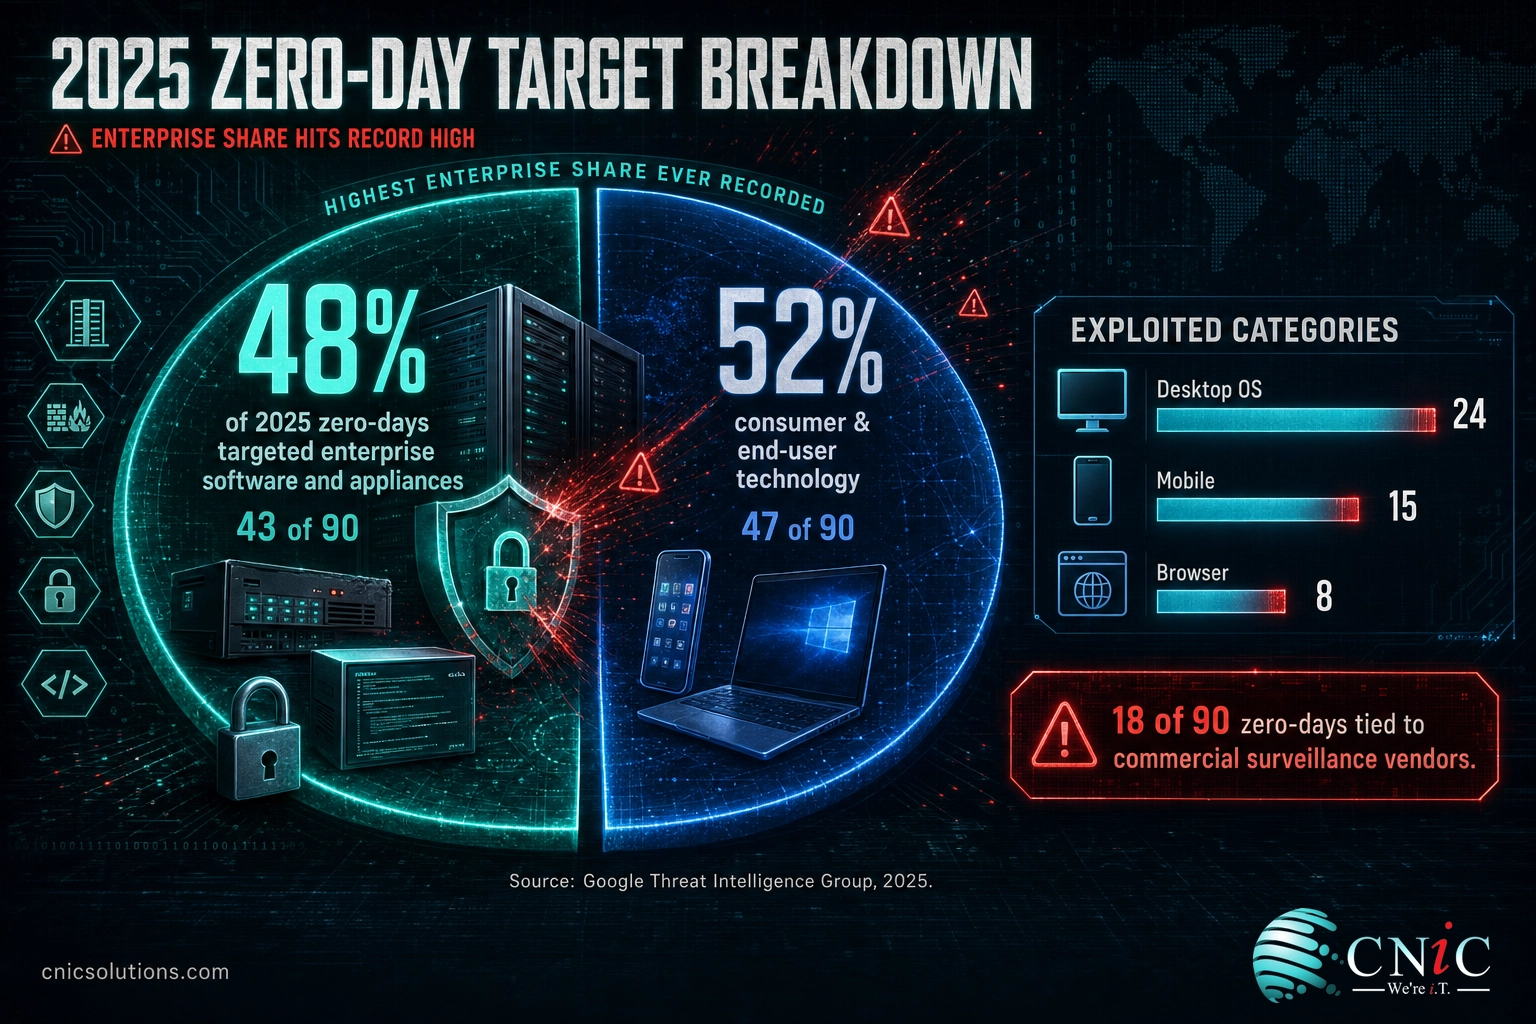
Attribution is getting clearer, too. Of the 90 zero-days, GTIG could directly attribute 42, and found that 18 were used by commercial surveillance vendors, the private companies that sell spyware and exploits to governments. For a typical business, the practical takeaway is defensive posture: you cannot patch a zero-day on day zero, so layered monitoring and rapid detection are what limit the damage while a fix is developed.
You can defend against zero-days without a patch. Because a fix does not exist at the moment of attack, resilience comes from other layers: network segmentation so one compromised device cannot reach everything, managed detection and response to catch the follow-on activity, and tight control over which edge devices are exposed to the internet at all. The zero-day is unavoidable. The blast radius is not.
Source: Google Threat Intelligence Group 2025 Zero-Day Review
Continuous monitoring is what turns an unpatchable zero-day into a contained incident instead of a breach.
See How Managed IT Covers the Gaps

4Time to Exploit vs Time to Remediate
This is the statistic that matters most, because it explains why disclosure counts and patch counts miss the point. Two clocks start the moment a vulnerability becomes public: how long attackers take to exploit it, and how long defenders take to fix it. In 2026 those two clocks are moving in opposite directions.
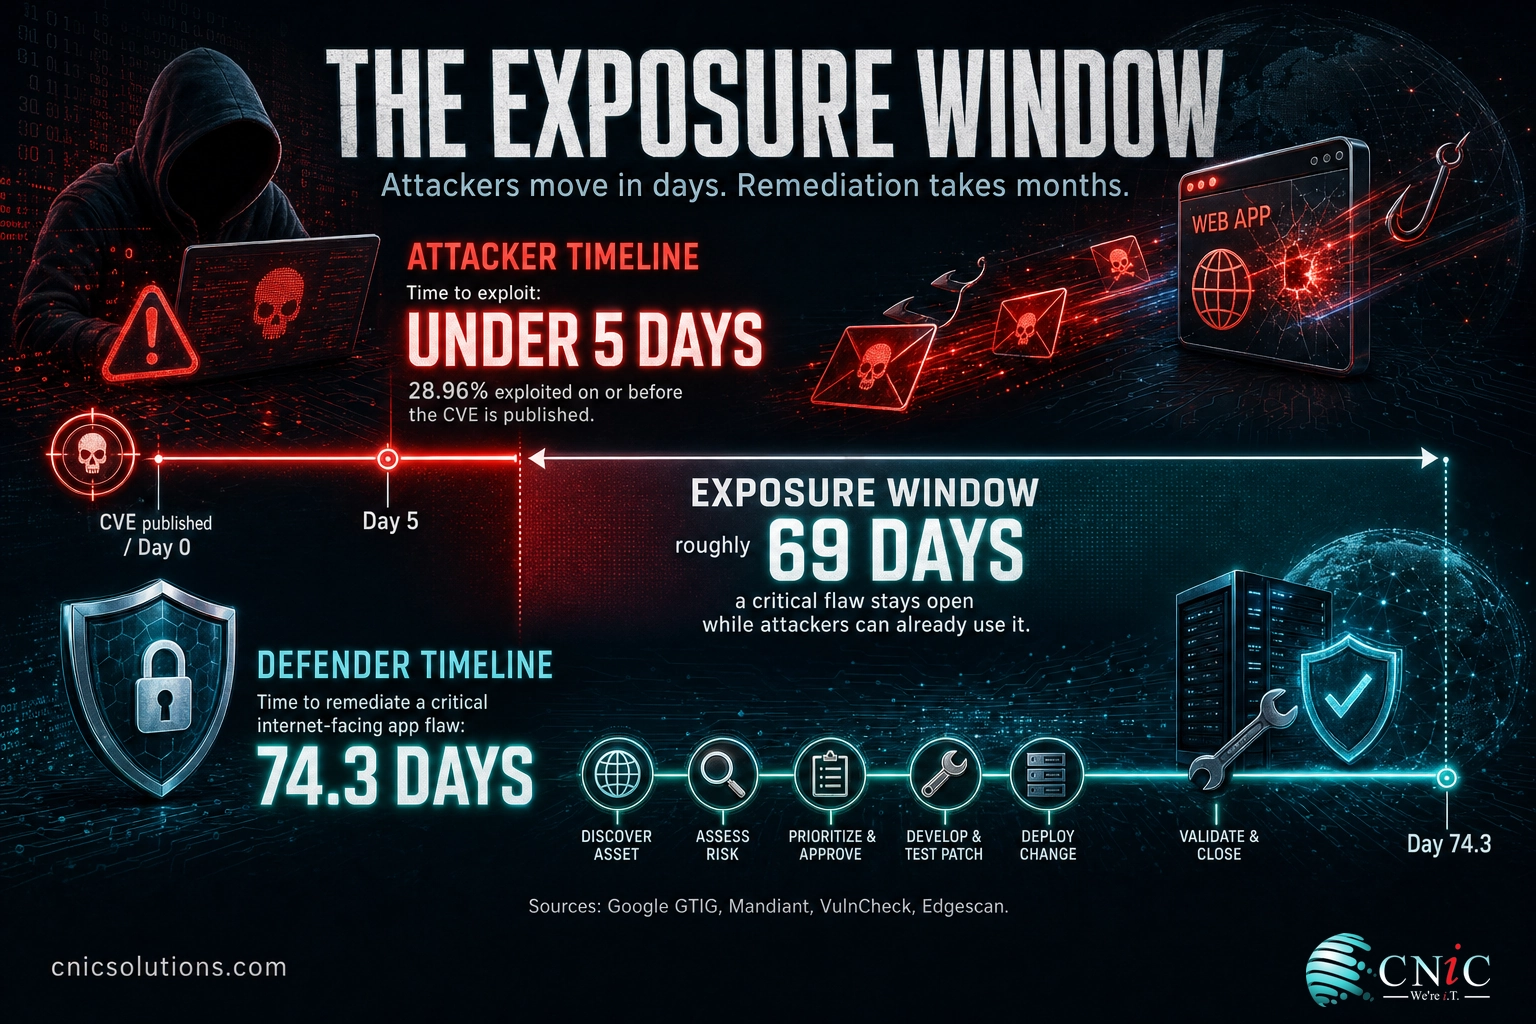
On the attacker side, the median time to exploit a new vulnerability has collapsed to under five days, down from around 32 days just a few years ago. VulnCheck found that 28.96% of the vulnerabilities newly exploited in 2025 showed exploitation evidence on or before the day their CVE was published, meaning exploitation frequently arrives at the same moment defenders first learn a flaw exists.
On the defender side, remediation still moves at the pace of quarterly maintenance. Edgescan’s 2025 analysis put the median time to remediate a critical application or API vulnerability at 74.3 days, and a critical network vulnerability at 54.8 days. More than 20% of the internet-facing vulnerabilities Edgescan discovered were high or critical severity, and the pace varies sharply by industry, from a 63-day average for software firms to 104 days for construction.
| Vulnerability class | Median / average time to remediate | Source |
|---|---|---|
| Critical application / API | 74.3 days (median) | Edgescan 2025 |
| Critical network | 54.8 days (median) | Edgescan 2025 |
| High / critical device & network | 39 days (average) | Edgescan 2025 |
| Edge devices (firewalls, VPNs) | 32 days (median) | Verizon 2025 DBIR |
| Fastest industry (software) | 63 days (average) | Edgescan 2025 |
| Slowest industry (construction) | 104 days (average) | Edgescan 2025 |
CNiC Solutions Analysis: The Exposure Window. Put the two clocks side by side. If attackers reach a median time to exploit of under 5 days (Google GTIG / Mandiant) while the median time to remediate a critical internet-facing application flaw is 74.3 days (Edgescan), a business is exposed for roughly 70 days on a vulnerability that attackers can already use. Formula: 74.3 days to remediate minus about 5 days to exploit equals an exposure window near 69 days per critical, internet-facing flaw. That gap, not the CVE count, is the real measure of vulnerability risk. Calculation and interpretation original to CNiC Solutions.
A quarterly patch cycle no longer fits the threat. When a meaningful share of exploitation happens on the day of disclosure, “we patch every quarter” leaves an internet-facing flaw open for up to 90 days after attackers are already using it. The businesses that stay ahead do not patch faster on the same schedule; they change the schedule to continuous, prioritized remediation driven by exploitation evidence.
Source: Edgescan 2025 Vulnerability Statistics Report | VulnCheck State of Exploitation 2025
Closing a 70-day exposure window is a management-and-infrastructure problem before it is a tooling problem.
Get Proactive Patch & Infrastructure Management
5Edge Devices, VPNs, and the Attack Surface
If there is one place the 2025 data says businesses are losing, it is at the network edge. Verizon found that 22% of all vulnerability-exploitation breaches targeted edge infrastructure, meaning firewalls, VPN concentrators, and remote-access gateways, an eightfold increase over the prior year. These devices are attractive precisely because they are exposed to the internet by design, run privileged software, and are often forgotten once installed.
The remediation numbers are the sobering part. Only 54% of the vulnerable edge devices Verizon observed were fully patched during the reporting window, and even those took a median of 32 days. That means roughly half of exposed, exploitable edge devices stayed vulnerable, while attackers moved in a matter of days. This is the mechanism behind many of the 2025 zero-days: an internet-facing appliance with a fresh flaw, no patch yet, and no one watching it.
Edge-Device Exploitation, Relative to the Prior Year
Exploitation of edge devices and VPNs rose eightfold year over year. Source: Verizon 2025 DBIR.
You cannot defend an attack surface you have not mapped. The practical starting point is knowing every internet-facing asset you own, a discipline covered in our guide to attack surface management, and closing the gaps that third-party software introduces, which we break down in the supply chain attack statistics for 2026.
The edge is where zero-days and slow patching collide. A firewall or VPN sits on the internet, runs privileged code, and is exactly the kind of enterprise appliance 2025 zero-days targeted. When that device also takes weeks to patch, the exposure window is wide open. Prioritizing edge and internet-facing systems for continuous monitoring and rapid patching gives the best risk reduction per hour of effort.
Source: Verizon 2025 Data Breach Investigations Report
Keeping edge devices, firewalls, and the wider network patched and monitored is core network infrastructure work.
6What This Means for Small and Midsize Businesses
Small and midsize businesses often assume vulnerability data is an enterprise problem. The 2025 numbers say the opposite. Exploitation is now automated and indiscriminate: once a flaw is public, mass scanning finds every exposed instance within days, and a small business firewall is exactly as reachable as a large one. Ransomware groups have industrialized this, and 20.5% of the vulnerabilities in CISA’s Known Exploited catalog are tied to ransomware operations.
The good news buried in this data is that the top causes are the fixable ones. Exploited vulnerabilities and stolen credentials account for 49% of intrusions on Mandiant’s frontline, and both respond to fundamentals: know your assets, prioritize by exploitation evidence, patch internet-facing systems fast, enforce multifactor authentication, and monitor for the activity that follows a breach. None of that requires an enterprise budget. It requires a process that runs continuously instead of once a quarter.
Myth: “We’re too small to be a target.” Attackers do not choose targets by size, they choose by exposure. Automated scanners hit every internet-facing device with a known-exploited flaw, and ransomware crews specialize in the underdefended. A small business with an unpatched VPN is a more attractive target than a large enterprise with a monitored, well-patched one. Being small is not protection; being disciplined is.
A practical priority order for SMBs. The table below turns 48,000 disclosures into a short, ranked work queue a managed provider can actually keep current. Work it top to bottom.
| Priority | What to patch first | Why it comes first |
|---|---|---|
| 1 | Anything on CISA’s Known Exploited Vulnerabilities catalog | Confirmed exploited in the wild, regardless of CVSS score |
| 2 | High-EPSS internet-facing flaws, especially firewalls, VPNs, gateways | Edge exploitation jumped 8x and is exposed by design |
| 3 | Remaining critical and high-severity issues on exposed systems | Reachable from the internet, so realistically attackable |
| 4 | Everything else, on a rolling schedule | Real risk, but no evidence of active exploitation yet |
Source: Mandiant M-Trends 2025 | CISA Known Exploited Vulnerabilities catalog
For most small and midsize businesses, continuous vulnerability and patch management is more reliable and less costly delivered as a managed service than staffed in-house.
Talk to CNiC About Managed Vulnerability Management
Summary Table: Every Stat at a Glance
| Statistic | Figure | Source | Year |
|---|---|---|---|
| New CVEs published | 48,185 | CVE Program | 2025 |
| Year-over-year change in CVE volume | +20.6% | CVE Program | 2025 |
| Average new CVEs per day | ~131 | CVE Program | 2025 |
| Zero-days exploited in the wild | 90 | Google GTIG | 2025 |
| Zero-days targeting enterprise tech | 48% (43 of 90) | Google GTIG | 2025 |
| Desktop OS zero-days | 24 | Google GTIG | 2025 |
| Rise in vulnerability exploitation as breach entry | +34% | Verizon DBIR | 2025 |
| Share of breaches via vulnerability exploitation | 20% | Verizon DBIR | 2025 |
| Exploits as initial infection vector | 33% (#1) | Mandiant M-Trends | 2025 |
| Vulnerabilities with first-time exploitation evidence | 884 | VulnCheck | 2025 |
| KEVs exploited on or before CVE publication | 28.96% | VulnCheck | 2025 |
| Median time to exploit a new vulnerability | <5 days | Google GTIG / Mandiant | 2023-2025 |
| Median time to remediate, critical app / API | 74.3 days | Edgescan | 2025 |
| Median time to remediate, critical network | 54.8 days | Edgescan | 2025 |
| Breaches targeting edge / VPN infrastructure | 22% | Verizon DBIR | 2025 |
| Increase in edge-device exploitation | 8x | Verizon DBIR | 2025 |
| Edge devices fully remediated in observed window | 54% | Verizon DBIR | 2025 |
| Median time to remediate edge devices | 32 days | Verizon DBIR | 2025 |
| KEV catalog vulnerabilities tied to ransomware | 20.5% | CISA KEV analysis | 2025 |
| Global median attacker dwell time | 11 days | Mandiant M-Trends | 2025 |
Frequently Asked Questions
How many vulnerabilities (CVEs) were disclosed in 2025?
How many zero-day vulnerabilities were exploited in 2025?
How fast are vulnerabilities exploited after disclosure?
What percentage of data breaches involve vulnerability exploitation?
How should a small or midsize business prioritize patching?
Methodology and Sources
How we compiled this report
Every figure in this article comes from a named primary source: government catalogs, annual threat-intelligence reports with disclosed methodology, and vulnerability data providers that publish their own original research. We did not use secondary blog aggregations or unattributed “up to X%” claims. Where a figure varies slightly by data source (annual CVE totals in particular), we note it and round rather than overstate precision. Derived figures, such as the exposure-window calculation, are clearly labeled as CNiC Solutions analysis with the source data and formula shown.
Primary sources cited:
- CVE Program metrics (cve.org) and the NIST National Vulnerability Database: annual CVE disclosure volume.
- Google Threat Intelligence Group, 2025 Zero-Day Review: zero-day counts, targets, and attribution.
- Verizon 2025 Data Breach Investigations Report: breach entry vectors, edge-device exploitation, remediation rates.
- Mandiant M-Trends 2025: initial infection vectors and dwell time from frontline incident response.
- VulnCheck State of Exploitation 2025: first-time-exploited vulnerability counts and time-to-exploit timing.
- Edgescan 2025 Vulnerability Statistics Report: mean and median time to remediate by severity, class, and industry.
- CISA Known Exploited Vulnerabilities catalog: the authoritative list of confirmed-exploited flaws, including ransomware association.
Media and press usage. Journalists, analysts, and bloggers are welcome to cite the statistics in this report with attribution to CNiC Solutions and a link back to this page. The exposure-window calculation and interpretation are original to CNiC Solutions. CNiC Solutions is a Houston-based managed IT and cybersecurity provider; where this report recommends managed vulnerability and patch management, it reflects CNiC’s own service model, disclosed for transparency.



related posts
What Is Endpoint Security? How It Protects Your Business Devices
October 19, 2026Endpoint security is the practice of protecting the devices that connect to your network, such as…
What Is FinOps? A Guide to Managing and Optimizing Cloud Costs
October 19, 2026FinOps is an operational framework and cultural practice for managing and optimizing cloud costs by bringing…
What Is Encryption in Cybersecurity?
October 18, 2026Encryption in cybersecurity is the process of scrambling readable data into an unreadable code that only…
What Is DNS? How the Internet’s Address Book Works
October 18, 2026DNS (Domain Name System) is the internet's address book. It translates the human-friendly domain names you…