
Infrastructure performance monitoring is the ongoing practice of tracking the health, speed, and availability of your IT systems, servers, networks, cloud platforms, storage, and applications, in real time. It collects performance data and raises alerts when something drifts from normal, so problems get caught and fixed before they turn into downtime. Infrastructure performance management is the wider discipline that acts on what monitoring reveals.
Every business now runs on technology it cannot afford to lose. When a server slows, a network chokes, or a cloud service stalls, employees lose productivity and customers feel it fast. Infrastructure performance monitoring is how you see trouble coming, and infrastructure performance management is how you do something about it. This guide explains what each one is, how they differ, the metrics that matter most, and why watching your infrastructure closely is one of the cheapest forms of insurance a business can buy.
Key Takeaways
- Monitoring watches, management acts. Infrastructure monitoring reports what is happening; infrastructure performance management decides what to do about it.
- Failures start small. Most outages begin as minor performance issues that monitoring is designed to catch long before users notice.
- A handful of metrics tell the story. CPU, memory, disk, network throughput and latency, uptime, and error rates cover most of what matters.
- Downtime is expensive. For most enterprises, a single hour of downtime now costs six figures or more, which is what makes early detection so valuable.
- Continuous monitoring is a staffing problem. Watching systems around the clock and responding to alerts is why many businesses hand it to a managed provider.
What’s in This Guide
- What Is Infrastructure Performance Monitoring?
- How Infrastructure Performance Monitoring Works
- Monitoring vs. Infrastructure Performance Management
- The Metrics That Matter
- Why It Matters: The Real Cost of Downtime
- Monitoring, Security, and Anomaly Detection
- From Monitoring to Management: Automation and Capacity Planning
- Managed Infrastructure Monitoring and Management
- Related Terms
- Frequently Asked Questions
What Is Infrastructure Performance Monitoring?
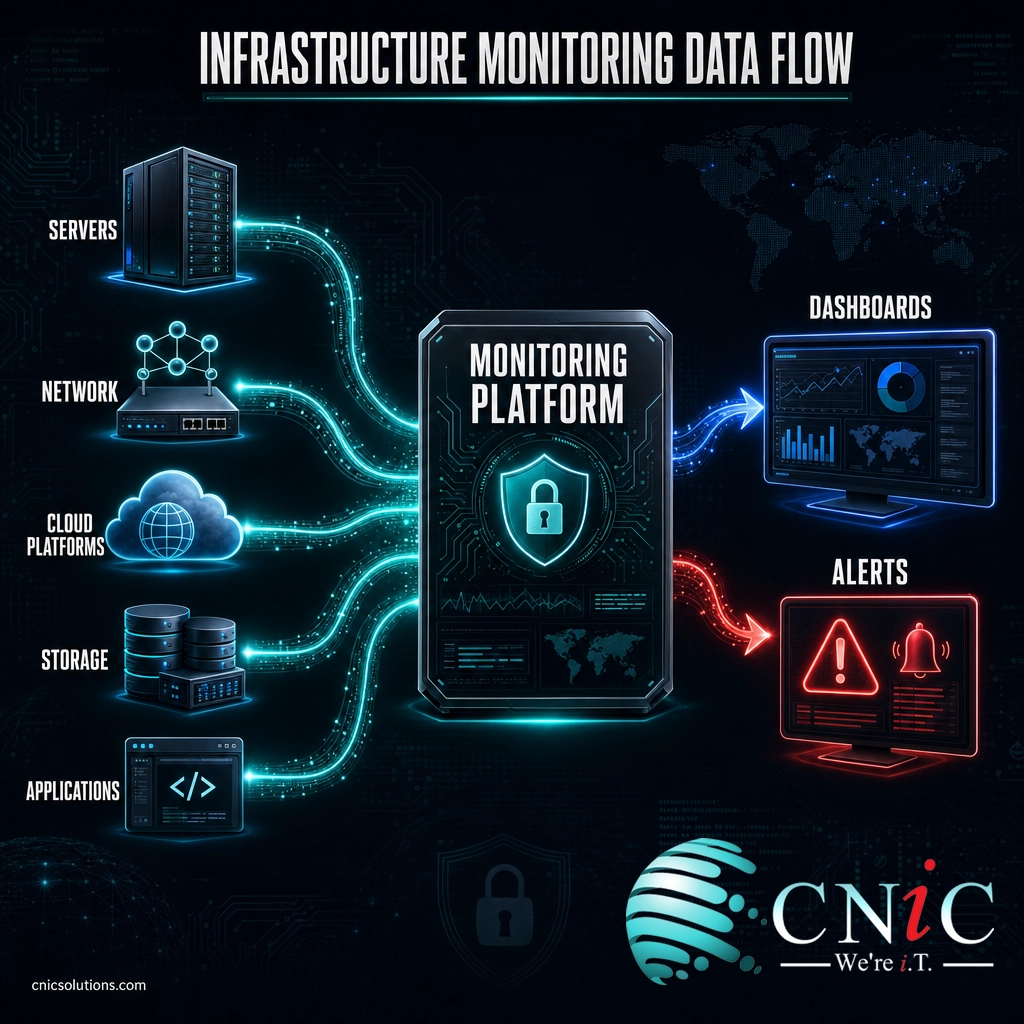
Infrastructure performance monitoring is the process of continuously observing how well your technology systems are running. It watches the performance and availability of the components a business depends on: physical and virtual servers, the network, cloud platforms, storage systems, and the applications sitting on top of all of it. Monitoring tools collect data from each of these layers, compare it against what normal looks like, and raise an alert the moment something falls out of range.
The word “performance” is the important part. Plenty of tools can tell you whether a server is on or off. Performance monitoring goes deeper, measuring whether that server is actually keeping up: responding quickly, handling its workload, and leaving enough headroom for demand. Infrastructure monitoring in this fuller sense is less about a simple up or down light and more about the quality of the experience your systems deliver.
It helps to picture your infrastructure as a set of connected systems that each need watching:
- Servers: CPU usage, memory utilization, and disk activity, the raw compute that everything else relies on.
- Networks: bandwidth, latency, and packet loss, which determine how fast and reliably data moves between systems and users.
- Cloud platforms: the availability and responsiveness of remotely hosted applications and data, so cloud services stay within expected limits.
- Storage: capacity and input and output performance, since a disk that is full or slow drags down everything reading from it.
- Applications: response times and resource use, which reveal a slow experience even when the underlying hardware looks healthy.
How Infrastructure Performance Monitoring Works
Under the surface, monitoring follows the same loop no matter which systems it watches. Think of it like the gauges and warning lights in a vehicle: sensors read what is happening, the dashboard shows it, and a light comes on before a small problem strands you on the road.
- Collect data. Lightweight agents, built-in APIs, and log shippers gather telemetry from each component, CPU load, memory use, latency, error counts, and more, and stream it to a central platform in real time or close to it.
- Set a baseline. The platform learns what normal looks like for each metric across a typical day and week, so it can tell an ordinary busy hour from a genuine problem.
- Compare and alert. Incoming data is measured against thresholds and baselines. When a metric crosses the line, the system raises an alert, often by email, text, or a ticket, and points to exactly which component is affected.
- Diagnose. Dashboards and historical trends let the team see whether a spike is momentary or building, and trace a symptom in one system back to its root cause in another.
- Act. Someone, or an automated rule, responds: freeing resources, restarting a service, or scheduling a fix before the issue reaches users.
That last step is where monitoring hands off to management, and it is the difference between a business that only knows it has a problem and one that resolves it quickly.
Source: Uptime Institute research
Monitoring vs. Infrastructure Performance Management
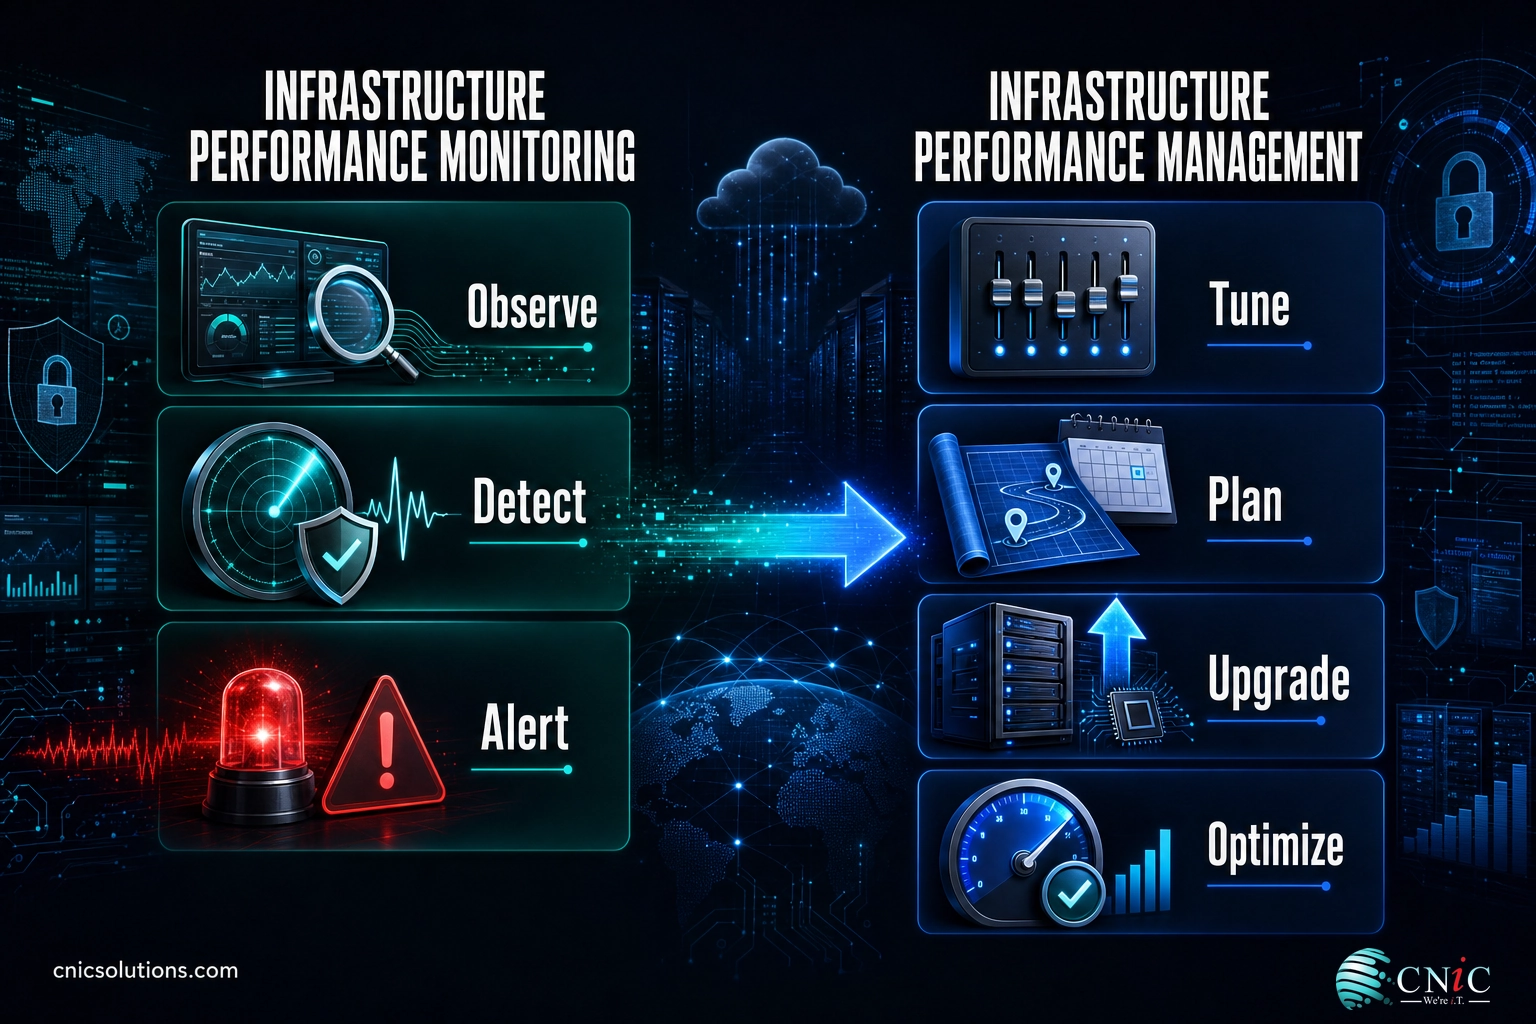
These two terms get used interchangeably, but they are not the same thing, and the distinction matters when you are deciding what your business actually needs. Monitoring is observation. Infrastructure performance management is action. One tells you the temperature; the other decides whether to open a window, turn on the air conditioning, or replace the thermostat.
| Aspect | Infrastructure Performance Monitoring | Infrastructure Performance Management |
|---|---|---|
| Core purpose | Observe and report system health | Act on findings to keep systems optimal |
| Main question | Is anything wrong right now? | What do we do about it, and how do we prevent it? |
| Typical activities | Data collection, alerting, dashboards | Tuning, capacity planning, upgrades, optimization |
| Time horizon | Real time and recent trends | Ongoing and forward looking |
| Output | Alerts and visibility | Decisions, changes, and improvements |
The two are inseparable in practice. Monitoring without management means alerts pile up and nothing improves. Management without monitoring means acting blind, guessing at what needs attention. A healthy operation runs both as one continuous cycle: watch, understand, act, then watch again. For a closer look at where the line falls, CNiC has a dedicated guide on how monitoring and management divide the work.
The Metrics That Matter
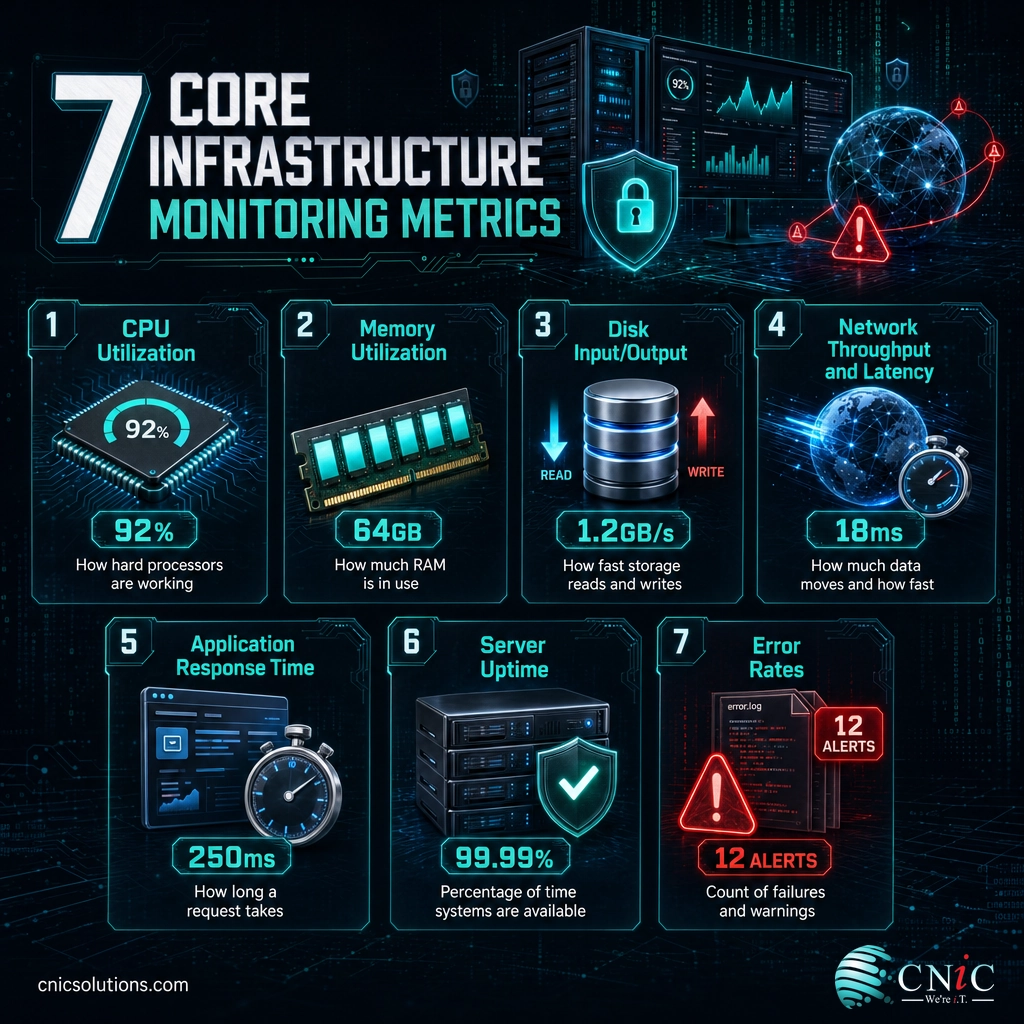
You do not need to track a thousand numbers to know whether your infrastructure is healthy. A focused set of core metrics covers most of what matters, and each one maps to a real business risk when it goes wrong.
- CPU utilization: how hard the processors are working. Sustained high CPU signals a system straining to keep up.
- Memory utilization: how much RAM is in use. Memory pressure slows applications and can crash services outright.
- Disk input and output: how quickly storage reads and writes data. Slow disk activity bottlenecks everything depending on it.
- Network throughput and latency: how much data moves and how fast. Rising latency or packet loss shows up as sluggish applications and dropped connections.
- Application response time: how long a request takes to complete. This is closest to what users actually feel.
- Server uptime and availability: the percentage of time a system is up and reachable, the headline number behind any service commitment.
- Error rates and system alerts: the count of failed requests, warnings, and faults, which often rise before a bigger failure.
The art is in reading them together. High CPU on its own may be fine; high CPU plus rising response time plus climbing error rates is a system about to fall over. Network metrics deserve particular attention because so many problems trace back to connectivity. CNiC covers that layer in depth in its guide to watching network infrastructure effectively.
Why It Matters: The Real Cost of Downtime
The case for monitoring comes down to a simple fact: infrastructure rarely fails all at once. It degrades. A disk fills gradually, memory leaks slowly, latency creeps upward. By the time users are complaining, the cheap window to fix the problem has already closed. Monitoring exists to catch those early signals while a fix still takes minutes instead of a crisis.
The reason that early window is worth so much is what downtime costs when you miss it.
Those numbers explain why uptime is measured so precisely. Availability is expressed in “nines,” and each additional nine cuts the downtime a business tolerates by roughly ten times. The gap between them is enormous:
Annual downtime allowed at each availability level
Reaching the higher tiers is impossible if you cannot see problems forming. Monitoring is the foundation that makes any serious availability target achievable.
Myth: If nothing looks broken, monitoring is optional
This is the assumption that turns a five-minute fix into a five-figure outage. “Nothing is broken” usually means “nothing has broken yet.” The whole value of monitoring is in the period before anything visibly fails, when a filling disk or a slow-climbing error rate is still a quiet warning rather than a stopped business. Waiting for something to break is choosing the most expensive way to find out.
Understanding what tends to fail helps too. CNiC breaks down the most common root causes of infrastructure failures, and separately covers how proactive infrastructure services cut downtime.
Source: ITIC 2024 Hourly Cost of Downtime | Uptime Institute Annual Outage Analysis 2024
Monitoring, Security, and Anomaly Detection
Performance monitoring and security monitoring overlap more than most people expect. Many attacks and compromises show up first as unusual performance behavior: an unexpected spike in network traffic, a server working far harder than its workload should require, or a burst of failed requests. Because monitoring already knows what normal looks like for every system, it is well positioned to flag the abnormal.
That does not make monitoring a replacement for dedicated security tools, but it does make it an early tripwire. A sudden, unexplained change in resource use or traffic patterns can be the first sign of a problem worth investigating, whether the cause is a failing component or an intrusion. Watching performance closely gives a business one more chance to notice something is wrong before it escalates.
From Monitoring to Management: Automation and Capacity Planning
Modern monitoring does more than send alerts. Increasingly, it triggers responses automatically. When a defined condition is met, the system can restart a stalled service, shift workloads, or reallocate resources on its own, resolving routine issues in seconds and without waiting for a human. This is the point where monitoring blends into management, and it is where automated infrastructure responses pay off most.
The other half of management is looking forward. Every metric monitoring collects becomes a record of how demand on your systems is changing. Analyze those trends and patterns emerge: storage that will run out in a quarter, a server whose peak load keeps climbing, a network approaching its ceiling. That history turns capacity planning from guesswork into evidence, letting a business schedule upgrades before a limit is reached rather than after it causes an outage. When the signs point one way, monitoring data makes the case, and CNiC outlines the clearest signals that infrastructure needs an upgrade.
Managed Infrastructure Monitoring and Management
Here is the practical catch. Monitoring only delivers value if someone is actually watching and ready to respond, and infrastructure does not keep business hours. Problems surface overnight, on weekends, and during holidays. Doing this well means round-the-clock coverage, tools that have to be configured and maintained, and people with the expertise to tell a false alarm from a real emergency and act on it fast. For most businesses, building that capability in-house is more than the workload justifies.
This is why so many organizations use a managed provider for infrastructure monitoring and management. Rather than staffing a monitoring desk yourself, you get a team that watches your systems continuously, responds to alerts as they happen, and handles the tuning, capacity planning, and upgrades that keep everything running well. You get the visibility and the follow-through, without carrying the whole operation internally.
As a full-service managed IT and infrastructure management partner, CNiC Solutions monitors client systems around the clock, acts on issues before they reach users, and uses performance data to plan ahead, so reliability becomes something you can count on rather than hope for.
Get expert help monitoring and managing your infrastructure
If monitoring is one piece of a bigger technology decision, a broader managed IT partnership can fold it into the full picture of how your systems are run and supported.

Related Terms
- IT infrastructure management: the broad discipline of running and maintaining all of a business’s technology systems. See what IT infrastructure management covers.
- Network infrastructure: the hardware and connections that move data across a business, and a major focus of monitoring. See how network infrastructure is built.
- Uptime: the percentage of time a system is operational and available, usually expressed in “nines.”
- Latency: the delay before data begins transferring, a key driver of how fast systems feel.
- Baseline: the normal range of a metric under typical conditions, used to judge whether current readings are a problem.
- Telemetry: the raw performance and health data that monitoring tools collect from systems.
- Capacity planning: using performance trends to forecast future demand and schedule upgrades before limits are reached.
Frequently Asked Questions
What is infrastructure performance monitoring?
What is the difference between infrastructure monitoring and infrastructure performance management?
What metrics does infrastructure performance monitoring track?
How does performance monitoring prevent downtime?
Why do businesses use managed infrastructure monitoring services?
Sources
Downtime cost figures come from the ITIC 2024 Hourly Cost of Downtime survey, which reports that a single hour of downtime exceeds $300,000 for more than 90% of mid-size and large enterprises, with 41% placing it between $1 million and more than $5 million. Outage cost distribution (54% of significant outages exceeding $100,000, and 20% exceeding $1 million) is drawn from the Uptime Institute Annual Outage Analysis 2024. Annual downtime figures by availability level are standard arithmetic derived from each stated uptime percentage. The monitoring components, metrics, and workflow described reflect widely documented, standard practice across the infrastructure monitoring field.
Primary sources: ITIC 2024 Hourly Cost of Downtime and Uptime Institute Annual Outage Analysis 2024.



related posts
What Is NIST Compliance? Frameworks, Requirements, and Who Needs It
October 25, 2026NIST compliance means aligning your organization's security program with the cybersecurity standards published by the National…
What Is Network Penetration Testing? Types and Process
October 25, 2026Network penetration testing is a controlled, authorized simulation of a real cyberattack on your network, run…
What Is Mobile Device Management (MDM)? A Guide for Businesses
October 24, 2026Mobile Device Management (MDM) is software that lets an organization remotely enroll, configure, secure, and monitor…
What Is MFA? How Multi-Factor Authentication Protects Your Accounts
October 24, 2026Multi-factor authentication (MFA) is a security method that requires two or more separate proofs of identity…