

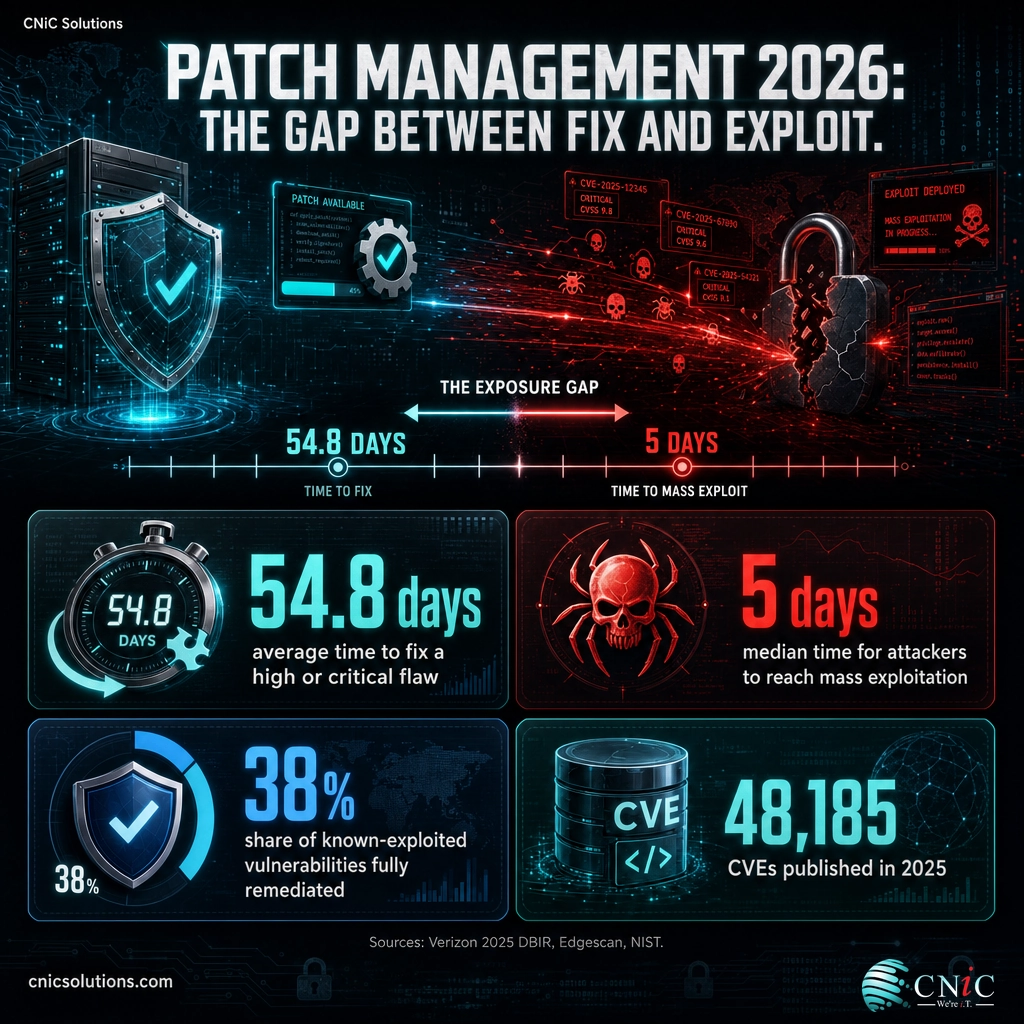
In 2025 the average high or critical software flaw took 54.81 days to patch, while attackers reached mass exploitation of newly disclosed vulnerabilities in a median of just 5 days. That gap, weeks of exposure on flaws criminals are already using, is the core patch management story of 2026.
- The volume is unmanageable by hand: a record 48,185 CVEs were published in 2025 (about 131 per day), up from 40,009 in 2024. (Edgescan, NIST)
- Fixing takes weeks, not days: average MTTR for a high or critical application and API flaw was 54.81 days in 2025; complex enterprise apps averaged 5 months and 10 days. (Edgescan, Qualys)
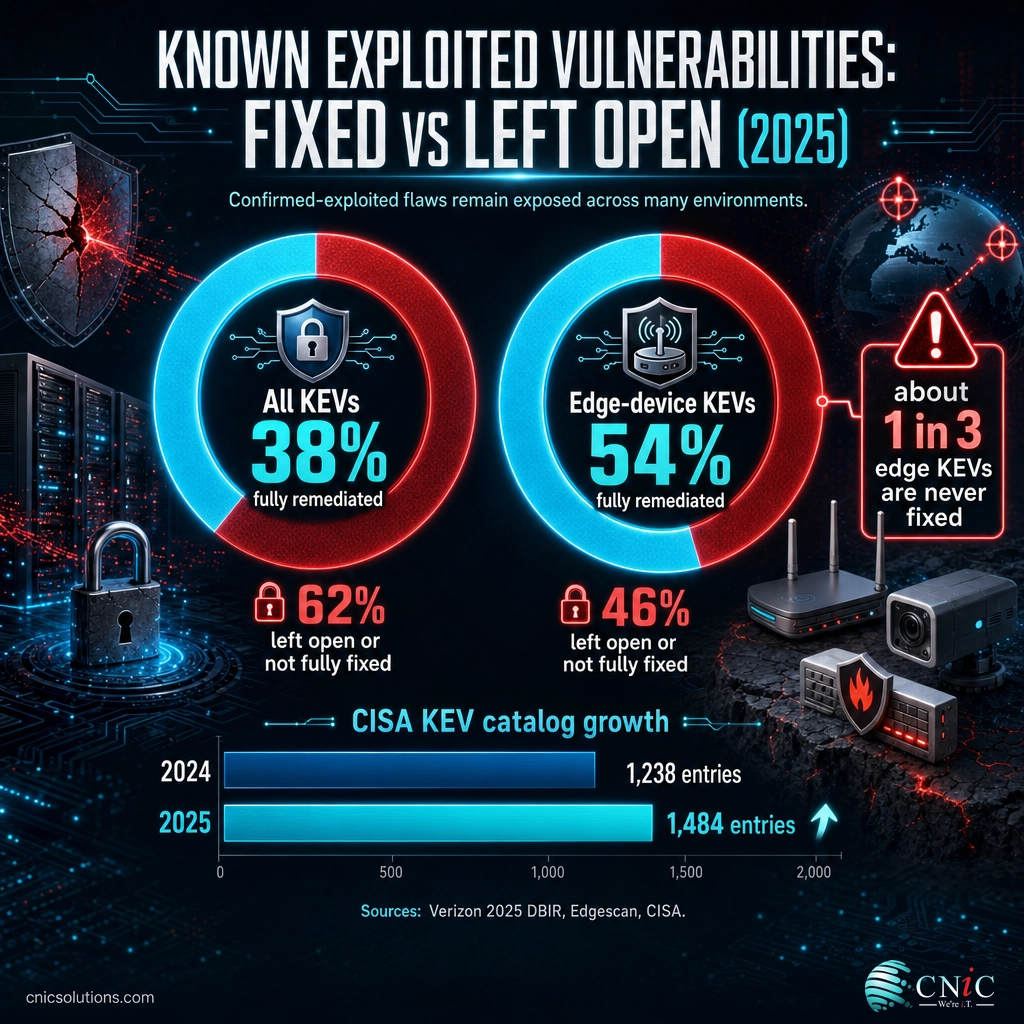
- Even known-exploited flaws linger: only 38% of CISA Known Exploited Vulnerabilities were fully remediated, and about 1 in 3 edge KEVs were never fixed. (Verizon 2025 DBIR)
- Attackers move first: the median time from disclosure to mass exploitation was 5 days overall and 0 days for edge devices. (Verizon 2025 DBIR)
- The stakes are rising: vulnerability exploitation appeared in 1 in 5 breaches, a 34% year-over-year jump, and was the most common root cause of ransomware at 32%. (Verizon, Sophos)
- Backlogs are the norm: large enterprises left 45.4% of discovered vulnerabilities unresolved within 12 months. (Edgescan)
- Small businesses feel it hardest: ransomware was present in 88% of small-business breaches versus 39% at large organizations. (Verizon 2025 DBIR)
What’s in This Report
- The Vulnerability Flood: How Many Patches We Face
- Mean Time to Remediate: How Long Patching Really Takes
- Patch Backlogs: The Vulnerabilities Left Behind
- Remediation Rates by Severity, Asset and Industry
- The Race Against Exploitation: Why the Clock Matters
- What Slow Patching Costs Small Businesses
- CISA KEV and Patch Deadlines: The Compliance Benchmark
- Every Statistic in One Table
- Frequently Asked Questions
- Methodology and Sources
1 The Vulnerability Flood: How Many Patches We Face
Patch management starts with a supply problem. The number of vulnerabilities disclosed every year has reached a level no team can address one at a time, which is why remediation now depends on prioritization rather than brute force.
CVE Publication Volume by Year
2025 set a record for published CVEs, a roughly 20% increase over the prior year. Source: Edgescan 2026 Vulnerability Statistics Report; NIST NVD.
The takeaway for any business is simple: no in-house team patches 48,000 flaws a year. The job is to find the small fraction that actually threatens your systems and fix those first, which is exactly what a disciplined managed vulnerability and patching program is built to do. Our companion breakdown of exploited CVEs and zero-day timing digs deeper into which of those flaws attackers weaponize.
Source: Edgescan Vulnerability Statistics Report | NIST National Vulnerability Database | Tenable Patch Tuesday 2025 Review
2 Mean Time to Remediate: How Long Patching Really Takes
Mean time to remediate, or MTTR, is the average number of days between discovering a vulnerability and fully fixing it. It is the metric that matters most in patch management because it measures how long an exploitable hole stays open. In 2025 those windows stayed stubbornly wide.
Mean Time to Remediate by Vulnerability Type (Days)
Even the fastest category, actively exploited edge-device flaws, still averages a month to fix. Sources: Edgescan, Verizon 2025 DBIR, Qualys.
Teams do triage the scariest flaws faster: an internet-facing device with a known exploit gets fixed in about 32 days, roughly three weeks quicker than an average high-risk application bug. But “faster” is relative. A month is still a long time to leave a door open when attackers are already walking through it, a gap we quantify in the exploitation section below.
Why patching is slower than it sounds. A patch is rarely a one-click action in a business environment. IT teams must test the update against production software, schedule a maintenance window, guard against downtime, and sometimes wait on a vendor’s own fix. That operational reality is why steady, monitored patching is a core deliverable of outsourced IT management rather than an afterthought.
See how managed IT keeps patching on schedule
Source: Edgescan Vulnerability Statistics Report | Verizon 2025 Data Breach Investigations Report | Qualys 2026 Patch Benchmark
3 Patch Backlogs: The Vulnerabilities Left Behind
Because disclosure outpaces remediation, unfixed findings pile up. The patch backlog, the set of known issues a business has not yet closed, is now a permanent feature of enterprise security rather than a temporary lapse.
| Backlog metric | Figure | What it means |
|---|---|---|
| Vulnerabilities unresolved within 12 months (large enterprises) | 45.4% | Nearly half of findings age past a year |
| Discovered vulnerabilities rated critical or high | Over 33% | A third of the backlog is high-stakes |
| All KEVs fully remediated | 38% | Most known-exploited flaws stay open |
| Edge-device KEVs fully remediated | 54% | Better, but nearly half remain |
| Edge-device KEVs left fully unremediated | ~33% | Highest non-remediation rate in the DBIR |
Myth: “We ran a scan, so we are covered.” A scan only produces a list. The Verizon and Edgescan data show that discovery is the easy half; the hard half is closing findings before they age out. An organization that scans monthly but remediates 38% of known-exploited flaws is documenting its exposure, not reducing it. Remediation, not detection, is where patch programs succeed or fail.
Get a free security audit to size your backlog
Source: Edgescan Vulnerability Statistics Report | Verizon 2025 Data Breach Investigations Report

4 Remediation Rates by Severity, Asset and Industry
Headline averages hide big differences. How fast a flaw gets fixed depends on how dangerous it is, where it lives, and what industry runs the system. These cuts of the data explain why two businesses can face the same vulnerability yet carry very different risk.
Mean Time to Remediate by Industry, Fastest vs Slowest (Days)
The slowest sector takes over 40 days longer than the fastest to fix the same class of flaw. Source: Edgescan 2025 Vulnerability Statistics Report.
The pattern holds across the data: severity and internet exposure pull remediation faster, while operational complexity and legacy hardware push it slower. Regulated small and midsize businesses, in healthcare, finance, and manufacturing, often sit on the slow end because their systems cannot simply be rebooted mid-shift. That is where a documented patch strategy, often owned by a virtual CIO, closes the gap without disrupting operations.
Modernize the infrastructure behind slow patch cycles
Source: Edgescan Vulnerability Statistics Report | Verizon 2025 Data Breach Investigations Report
5 The Race Against Exploitation: Why the Clock Matters
Patch metrics only matter because attackers are racing the same clock. In 2026 the data shows they are winning the opening laps: exploitation now begins before, or at the moment, most defenders even start.
| Exploitation metric | Figure | Source |
|---|---|---|
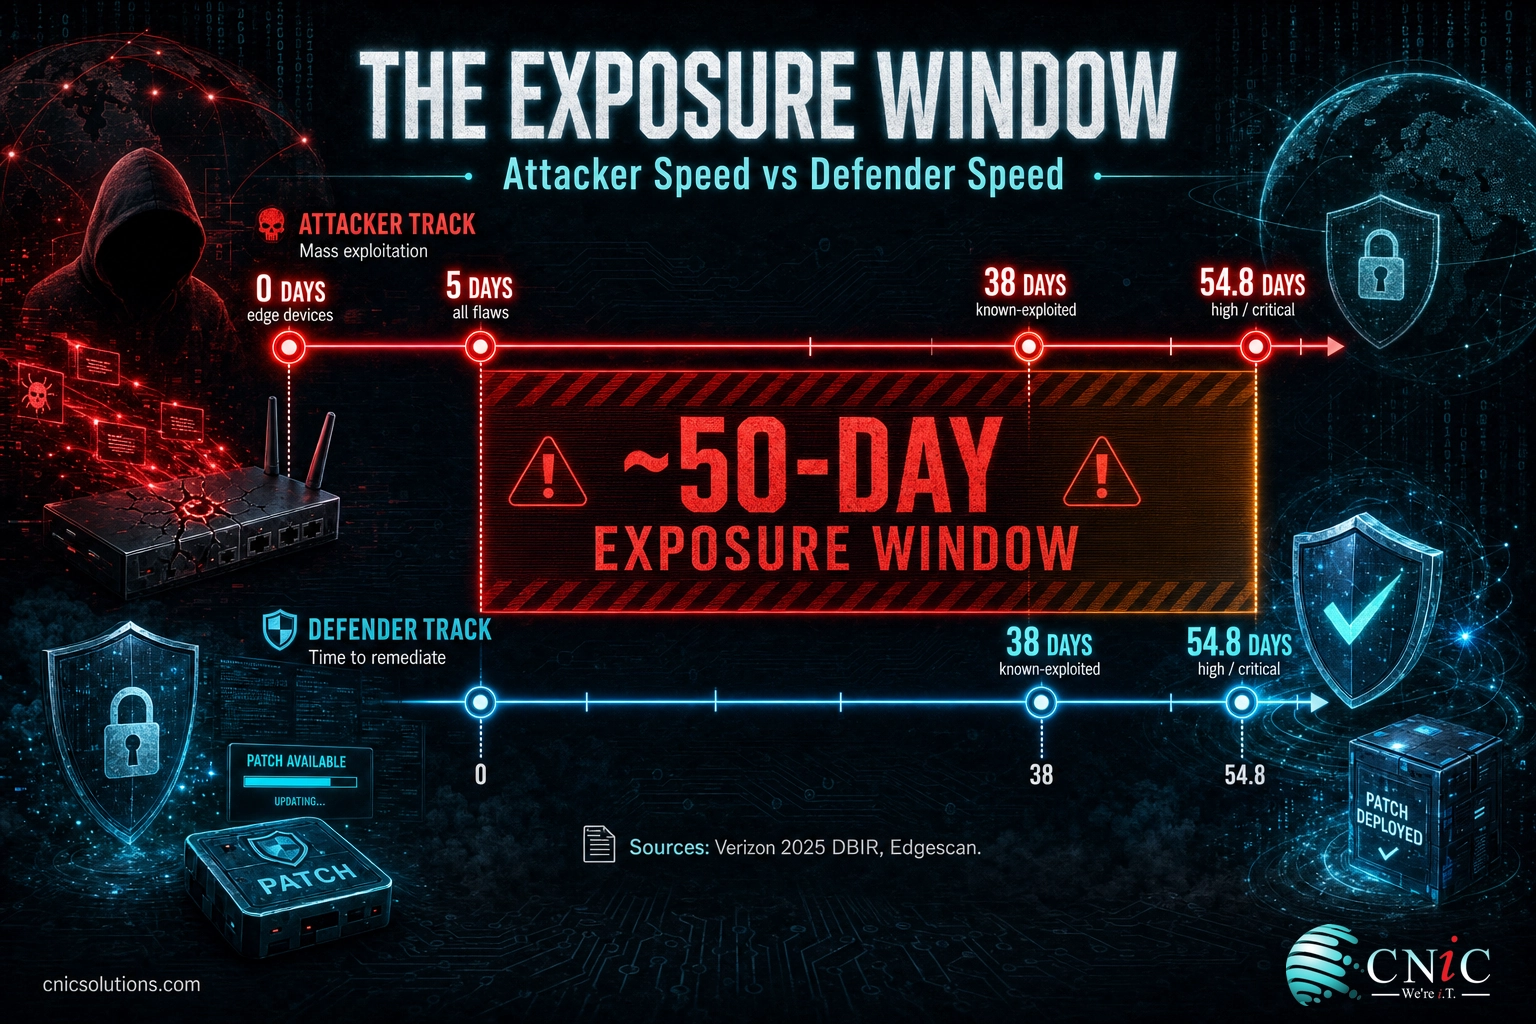
| Median disclosure to mass exploitation (all KEV) | 5 days | Verizon 2025 DBIR |
| Median disclosure to mass exploitation (edge devices) | 0 days | Verizon 2025 DBIR |
| Breaches involving vulnerability exploitation | 20% (+34% YoY) | Verizon 2025 DBIR |
| Exploitation breaches that hit edge devices | 22% (8x prior year) | Verizon 2025 DBIR |
| Intrusions starting with an exploit | 33% | Mandiant M-Trends 2025 |
| CVEs first exploited in the wild in 2024 | 768 | Edgescan 2025 Report |
CNiC Solutions Analysis: The 50-Day Exposure Window. Combine two Tier 1 figures and the danger becomes concrete. Attackers reach mass exploitation of a new flaw in a median of 5 days (Verizon 2025 DBIR), while the average high or critical fix takes 54.81 days (Edgescan 2026 Report). The difference, 54.81 minus 5, is about 50 days during which a publicly exploited vulnerability sits unpatched on a typical network. For internet-facing edge devices, where exploitation starts at zero days, the entire remediation period is exposure. Calculation and interpretation original to CNiC Solutions.
Build recovery that survives a missed patch
Source: Verizon 2025 Data Breach Investigations Report | Mandiant M-Trends 2025 | Edgescan Vulnerability Statistics Report
6 What Slow Patching Costs Small Businesses
For a small or midsize business, the patch gap is not an abstract metric. It is the most common way ransomware gets in, and small companies absorb the damage at a far higher rate than large ones.
| Why patch gaps hurt SMBs | Figure | Source |
|---|---|---|
| Ransomware root cause that was an exploited flaw | 32% | Sophos State of Ransomware 2025 |
| SMB breaches involving ransomware | 88% | Verizon 2025 DBIR |
| Large-org breaches involving ransomware | 39% | Verizon 2025 DBIR |
| All breaches involving ransomware | 44% | Verizon 2025 DBIR |
The reason smaller organizations are hit harder is the same reason their MTTR runs high: fewer hands, slower patch cycles, and thinner incident response. Attackers know it. Closing the exploited-vulnerability path, the entry point in roughly a third of ransomware cases, is the highest-return move a small business can make, and it is almost entirely a patching and configuration discipline.
Get a patch strategy built for your business
Source: Sophos State of Ransomware 2025 | Verizon 2025 Data Breach Investigations Report
7 CISA KEV and Patch Deadlines: The Compliance Benchmark
If 48,000 CVEs a year is too many to chase, the CISA Known Exploited Vulnerabilities catalog is the shortlist that matters. It names the flaws confirmed to be under active attack, and for federal agencies it comes with hard remediation deadlines that private businesses increasingly treat as a benchmark.
| CISA KEV metric | 2024 | 2025 |
|---|---|---|
| Total catalog entries (year end) | 1,238 | 1,484 |
| Vulnerabilities added during the year | 185 | 246 |
| Share of all KEVs fully remediated | n/a | 38% |
| Share of edge KEVs fully remediated | n/a | 54% |
Use the KEV catalog as your patch queue. Under Binding Operational Directive 22-01, CISA assigns every KEV a due date and requires federal agencies to fix it by then. Any business can subscribe to the same list and treat it as a prioritized patch queue, addressing confirmed-exploited flaws first. It turns an impossible 48,000-item problem into a few hundred that genuinely demand action.
Source: CISA Known Exploited Vulnerabilities Catalog | CISA Binding Operational Directive 22-01 | Edgescan Vulnerability Statistics Report
8 Every Patch Management Statistic in One Table
A single reference view of every figure in this report, with its primary source and year. Journalists and analysts are welcome to cite these with attribution.
| Statistic | Figure | Source | Year |
|---|---|---|---|
| CVEs published | 48,185 | Edgescan / NIST NVD | 2025 |
| CVEs published (prior year) | 40,009 | Edgescan | 2024 |
| Average new CVEs per day | ~131 | Edgescan / NIST NVD | 2025 |
| CVEs NVD fully enriched | 28% | NIST | 2025 |
| Microsoft CVEs patched (Patch Tuesday) | 1,139 | Tenable | 2025 |
| Microsoft zero-days patched | 41 (24 exploited) | Tenable | 2025 |
| MTTR, high/critical app & API | 54.81 days | Edgescan | 2025 |
| Median MTTR, all KEVs | 38 days | Verizon DBIR | 2025 |
| Median MTTR, edge-device KEVs | 32 days | Verizon DBIR | 2025 |
| MTTR, complex enterprise apps | 5 mo 10 d | Qualys | 2026 |
| MTTR, software sector (fastest) | 63 days | Edgescan | 2024 |
| MTTR, construction sector (slowest) | 104 days | Edgescan | 2024 |
| Vulnerabilities unresolved within 12 months | 45.4% | Edgescan | 2024 |
| Discovered vulnerabilities rated critical/high | Over 33% | Edgescan | 2024 |
| All KEVs fully remediated | 38% | Verizon DBIR | 2025 |
| Edge KEVs fully remediated | 54% | Verizon DBIR | 2025 |
| Edge KEVs left fully unremediated | ~33% | Verizon DBIR | 2025 |
| Median disclosure to mass exploitation (all KEV) | 5 days | Verizon DBIR | 2025 |
| Median disclosure to mass exploitation (edge) | 0 days | Verizon DBIR | 2025 |
| Breaches involving vulnerability exploitation | 20% (+34% YoY) | Verizon DBIR | 2025 |
| Exploitation breaches hitting edge devices | 22% (8x) | Verizon DBIR | 2025 |
| Intrusions starting with an exploit | 33% | Mandiant M-Trends | 2025 |
| Ransomware with an exploited flaw as root cause | 32% | Sophos | 2025 |
| SMB breaches involving ransomware | 88% | Verizon DBIR | 2025 |
| All breaches involving ransomware | 44% | Verizon DBIR | 2025 |
| CISA KEV catalog entries (year end) | 1,484 | Edgescan | 2025 |
| Vulnerabilities added to KEV catalog | 246 | Edgescan | 2025 |
| CVEs first exploited in the wild | 768 | Edgescan | 2024 |
9 Frequently Asked Questions
What is the average time to patch a vulnerability in 2026?
What is MTTR in patch management?
What percentage of known exploited vulnerabilities actually get patched?
How fast do attackers exploit a new vulnerability?
Why do patch backlogs happen?
10 Methodology and Sources
How this report was compiled
Every figure in this article is drawn from a Tier 1 primary source: government agencies, major analyst and vendor research with disclosed methodology, and annual industry reports. No statistic is sourced from a blog citing another blog, and no figure is invented or estimated except the clearly labeled CNiC Solutions Analysis, which shows its formula and contributing sources. Where a figure describes 2024 rather than 2025, that year is stated alongside it.
Primary sources
- Verizon 2025 Data Breach Investigations Report (DBIR): KEV remediation rates, median time to remediate, disclosure-to-exploitation timing, breach vectors, ransomware prevalence.
- Edgescan Vulnerability Statistics Report (2025 and 2026 editions): MTTR by severity and industry, unresolved-backlog rates, CVE volume, KEV catalog growth.
- Qualys 2026 Enterprise Patch & Remediation Benchmark: complex-application MTTR and patch-deployment volumes.
- Mandiant M-Trends 2025: exploits as the leading initial infection vector.
- Sophos State of Ransomware 2025: exploited vulnerabilities as the top ransomware root cause.
- CISA Known Exploited Vulnerabilities Catalog and Binding Operational Directive 22-01: remediation deadlines and the KEV shortlist.
- NIST National Vulnerability Database: CVE publication volume and enrichment backlog.
- Tenable, Microsoft Patch Tuesday 2025 Year in Review: Microsoft CVE and zero-day totals.
Press and citation use. Journalists, analysts, and researchers are welcome to cite the statistics in this report with attribution to CNiC Solutions and a link to this page, alongside the original primary source noted for each figure. The CNiC Solutions Analysis box may be cited as original analysis.



related posts
What Is Endpoint Security? How It Protects Your Business Devices
October 19, 2026Endpoint security is the practice of protecting the devices that connect to your network, such as…
What Is FinOps? A Guide to Managing and Optimizing Cloud Costs
October 19, 2026FinOps is an operational framework and cultural practice for managing and optimizing cloud costs by bringing…
What Is DNS? How the Internet’s Address Book Works
October 18, 2026DNS (Domain Name System) is the internet's address book. It translates the human-friendly domain names you…
What Is Encryption in Cybersecurity?
October 18, 2026Encryption in cybersecurity is the process of scrambling readable data into an unreadable code that only…