

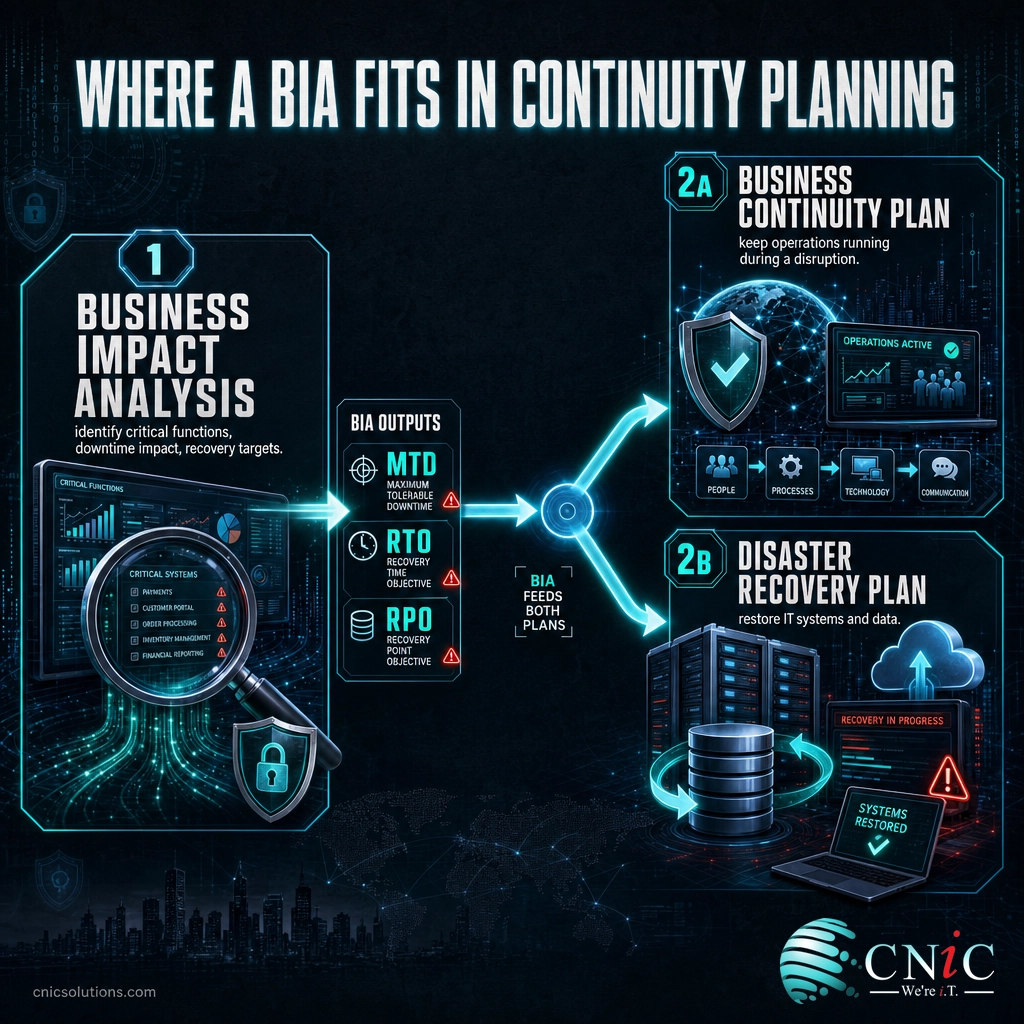
A business impact analysis (BIA) is a systematic process that predicts how a disruption to critical operations would affect a business over time. It identifies which functions matter most, estimates the financial and operational damage of downtime, and sets the recovery priorities and timelines that guide continuity and disaster recovery planning.
Every business runs on a handful of processes it cannot afford to lose for long. A business impact analysis is how you find out exactly which ones those are, what an outage would cost you by the hour, and how fast each function has to be back before the damage becomes permanent. It turns “we should be prepared” into specific, defensible recovery targets, which is why the BIA is the first real step in any continuity or disaster recovery program.
- A BIA answers a different question than a risk assessment. It measures the impact of downtime on your operations, not the likelihood of a specific threat.
- It produces your recovery targets. The BIA is where maximum tolerable downtime (MTD), recovery time objective (RTO), and recovery point objective (RPO) come from, and those numbers drive every backup and recovery decision that follows.
- Downtime is expensive and getting more so. The Uptime Institute found 54% of significant outages now cost more than $100,000, and 20% top $1 million.
- It forces prioritization. A BIA ranks processes by impact so you protect what matters first instead of spreading budget evenly across everything.
- It is the required starting point. You cannot write a credible business continuity or disaster recovery plan without one, because there is nothing to base the recovery strategy on.
What’s in This Guide
What Is a Business Impact Analysis?
A business impact analysis is the exercise of working out what your organization actually stands to lose when a critical process stops. It looks at each important business function, such as order processing, patient scheduling, billing, or production, and asks two questions: how bad does the damage get, and how quickly does it escalate?
The federal preparedness program Ready.gov describes the BIA as a process that “predicts the consequences of disruption of a business function and process and gathers information needed to develop recovery strategies.” That second half matters. A BIA is not an academic report that sits on a shelf. Its whole purpose is to produce the inputs your recovery plans are built on, according to Ready.gov’s business impact analysis guidance.
Impacts fall into two broad buckets. Operational impacts are the non-dollar consequences: delayed service, missed deadlines, contract penalties, compliance violations, and reputational harm. Financial impacts are the measurable losses: lost revenue, idle payroll, recovery costs, and regulatory fines. A good BIA captures both, because a two-hour outage that breaches a compliance deadline can hurt far more than the raw revenue lost in those two hours.
Crucially, the impact of a disruption grows over time. Losing your point-of-sale system for five minutes is an annoyance. Losing it for a full business day is a crisis. Plotting how impact escalates by the hour is what lets you set a defensible cutoff for how long each function can be down, which is the core output of the analysis.
How a Business Impact Analysis Works
A BIA follows a consistent sequence whether you are a ten-person firm or a hospital system. The scale changes, the logic does not. Think of it like triage in an emergency room: before you treat anyone, you sort patients by how urgently they need care and what happens if they wait. A BIA does the same thing to your business processes.
The process runs in five steps:
- Inventory your business functions. List the processes the organization performs, from the obvious (invoicing, fulfillment) to the easily forgotten (payroll, access control, phone support).
- Identify what each function depends on. Map the people, applications, data, vendors, and equipment each process needs. A single system often supports several functions, and one hidden dependency can stall everything.
- Estimate the impact of downtime over time. For each function, work out the operational and financial damage at intervals: one hour down, one day, one week. The point where the damage becomes unacceptable defines its recovery deadline.
- Prioritize by criticality. Rank functions from most to least time-sensitive. This ranking, not gut feel, decides where recovery investment goes first.
- Set recovery objectives. Assign each critical function its recovery targets (MTD, RTO, and RPO, covered below). These numbers become the requirements your continuity and recovery strategies must meet.
The output is a prioritized map of your operation: what matters most, what it depends on, how long it can be down, and how much recent data you can afford to lose. That map is the raw material for a business continuity plan, which lays out how the organization keeps running during a disruption.

BIA vs. Risk Assessment: The Key Difference
The single most common point of confusion is treating a business impact analysis and a risk assessment as the same thing. They are close partners in a continuity program, but they answer opposite questions, and using one in place of the other leaves a serious gap.
A risk assessment looks forward at threats: what could go wrong (ransomware, a flood, a power failure, a key vendor collapsing), how likely each is, and how to reduce that likelihood. A BIA looks at consequences: assuming a critical function goes down, regardless of what caused it, how badly does it hurt and how fast must it recover? One is about probability and prevention; the other is about impact and recovery.
| Attribute | Business Impact Analysis (BIA) | Risk Assessment |
|---|---|---|
| Core question | If this stops, how much does it hurt and how fast must it recover? | What could go wrong, and how likely is it? |
| Focus | Impact and consequences of downtime | Threats, vulnerabilities, and likelihood |
| Cause matters? | No, impact is measured regardless of cause | Yes, the specific threat is the whole point |
| Main output | Recovery priorities and targets (MTD, RTO, RPO) | A ranked list of risks and mitigation steps |
| Answers | How to recover | How to prevent |
In practice the two work together. Many organizations run a risk assessment alongside the BIA so they understand both the threats they face and the impact of those threats landing. If you want to see the prevention side in depth, our explainer on a cybersecurity risk assessment covers how threats and likelihood are scored.
Myth: a risk assessment is enough on its own. A risk assessment tells you a ransomware attack is likely. It does not tell you that your billing system must be back within four hours or you breach a payer contract. Only a BIA sets that recovery deadline. Skip the BIA and you may harden the wrong systems while the truly time-critical ones have no defined recovery target at all.
Why a BIA Matters for Your Business
The case for a BIA comes down to one uncomfortable fact: downtime is expensive, and most organizations underestimate it until it happens. Putting real numbers on that exposure is what moves continuity planning from a “someday” project to a funded priority.
The Uptime Institute’s 2024 outage analysis found that outages are becoming more costly even as they become less frequent. Among organizations that experienced a significant outage, 54% said it cost more than $100,000, and 20% said it exceeded $1 million, a jump the Institute attributes to the rising criticality of digital services, inflation, and longer recovery times.
Per-hour figures are just as sobering. In ITIC’s 2024 Hourly Cost of Downtime survey of more than 1,000 firms, over 90% of mid-size and large enterprises said a single hour of downtime costs them more than $300,000, and 41% put the cost between $1 million and more than $5 million per hour. Those numbers are exactly what a BIA converts into a recovery deadline: if an hour costs six figures, a four-hour recovery target is easy to justify to a budget owner.
Beyond the raw cost, a BIA delivers three things no organization gets by guessing. It exposes hidden dependencies before an outage does, so you learn that fulfillment secretly relies on an aging server in advance instead of at 2 a.m. during a failure. It aligns spending with actual risk, so the most critical functions get the strongest protection. And it satisfies auditors and regulators: frameworks and standards such as the ISO 22301 business continuity standard expect a documented impact analysis as evidence that recovery priorities are grounded in analysis, not assumption. That link between the BIA and provable diligence is a recurring theme in IT compliance for growing businesses.
Source: Uptime Institute, Annual Outage Analysis 2024 | ITIC, 2024 Hourly Cost of Downtime
What a BIA Measures: MTD, RTO, and RPO
The most valuable output of a BIA is a set of recovery objectives for each critical process. These are the numbers your entire recovery strategy is engineered to hit, and they come straight from the government standard that defines contingency planning, NIST Special Publication 800-34. Three metrics do most of the work.
| Metric | What it defines | Plain-English question |
|---|---|---|
| MTD Maximum Tolerable Downtime |
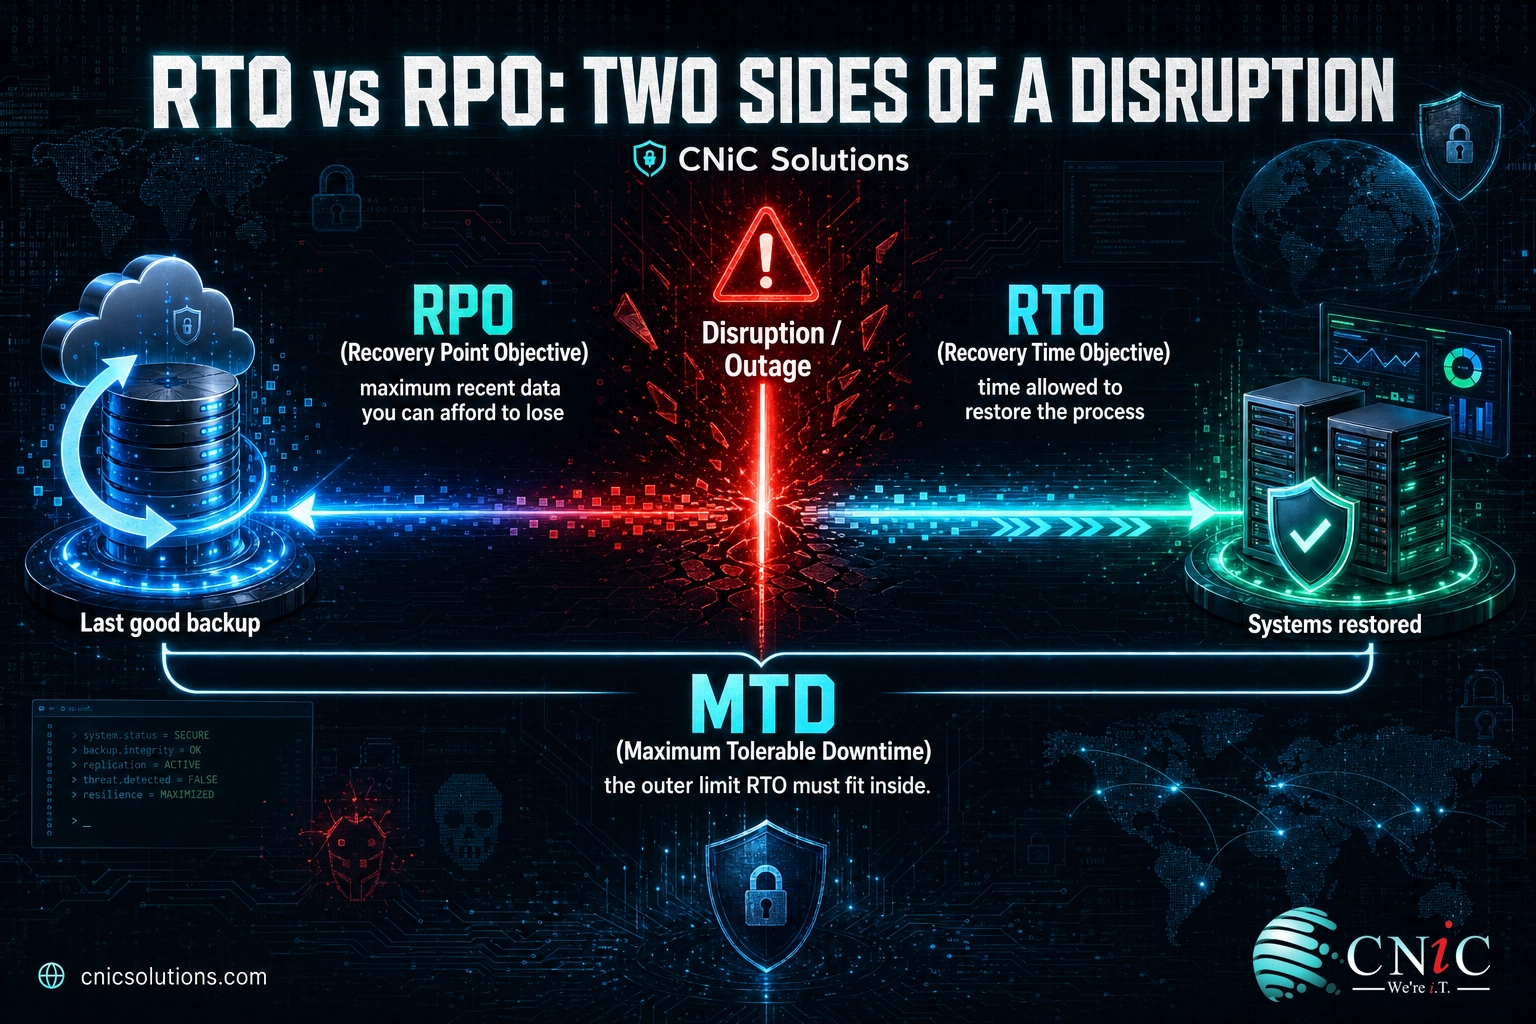
The total time a process can be down before the damage is unacceptable. It is the outer limit that RTO must fit inside. | How long can this be down before it threatens the business? |
| RTO Recovery Time Objective |
The target time to restore a process after a disruption. It must be shorter than the MTD to leave room for the impact assessment and handoffs. | How fast do we need it back? |
| RPO Recovery Point Objective |
The maximum amount of recent data you can afford to lose, measured backward from the disruption to your last usable backup. | How much recent data can we afford to lose? |
The difference between RTO and RPO is where people get stuck, so here is the clean version. RTO is about time: how long until we are running again. RPO is about data: how far back our last good copy can be. A four-hour RTO with a fifteen-minute RPO means the system must be restored within four hours, using a backup no older than fifteen minutes. RTO drives your recovery infrastructure and staffing; RPO drives how often you back up and replicate data.
These three numbers are precisely what a disaster recovery plan is built to satisfy. Without them, a recovery plan is guessing at how fast and how complete its restores need to be. With them, every technology choice, from backup frequency to failover design, has a target to meet.
Source: NIST SP 800-34 Rev. 1, Contingency Planning Guide for Federal Information Systems
How to Get Started With a BIA
You do not need an enterprise-grade project to get real value from a business impact analysis. The most important move is to start with the processes that clearly matter and expand from there. A practical first pass looks like this:
- Scope it tight. Pick the five to ten processes the business would notice within a day if they stopped. Perfect coverage is the enemy of a finished BIA.
- Talk to the people who run the work. Department leads know the real dependencies and the true cost of downtime far better than an org chart does. Interviews and short questionnaires are the standard tools.
- Quantify where you can, estimate where you cannot. Even rough hourly cost ranges are enough to rank priorities and justify recovery targets.
- Document the outputs. Record each critical function, its dependencies, its impact over time, and its MTD, RTO, and RPO. That document is your BIA.
- Review it regularly. Revisit at least annually and after any major change so the analysis keeps pace with the business.
For many small and midsize businesses, the hard part is not the concept but the objectivity and technical depth it takes to map dependencies and set realistic recovery targets. This is a natural fit for outside help. A managed IT partner or a virtual CIO conducts BIAs regularly, knows where hidden dependencies tend to hide, and can translate the findings straight into backup, recovery, and continuity strategy.
Explore Managed Backup & Disaster Recovery
Talk to a Virtual CIO About Continuity
Common Questions About Business Impact Analysis
What is a business impact analysis (BIA)?
What is the difference between a BIA and a risk assessment?
What does a business impact analysis produce?
How often should you conduct a business impact analysis?
Do small businesses need a business impact analysis?
Related Terms
- Business continuity plan (BCP): the documented strategy for keeping critical operations running during a disruption, built directly on the priorities a BIA identifies. See how to create a business continuity plan.
- Disaster recovery plan (DRP): the technical playbook for restoring IT systems and data to meet the RTO and RPO targets the BIA sets. Follow a step-by-step disaster recovery template.
- Cybersecurity risk assessment: the companion analysis that identifies threats and their likelihood, where a BIA measures the impact of those threats landing.
- Maximum tolerable downtime (MTD): the longest a process can be down before the consequences become unacceptable to the business.
- Recovery time objective (RTO): the target time to restore a process after an outage, always set within the MTD.
- Recovery point objective (RPO): the maximum amount of recent data a process can afford to lose, which sets your backup frequency.
- Data retention policy: the rules governing how long data is kept and when it is deleted, closely tied to your RPO and backup design. Learn how to build a data retention policy.
- Business continuity management (BCM): the overall discipline, formalized in standards like ISO 22301, that the BIA feeds as its analytical starting point.
About This Guide
The definition and role of a business impact analysis follow federal preparedness guidance from Ready.gov and the contingency planning framework in NIST Special Publication 800-34 Revision 1, which defines the maximum tolerable downtime, recovery time objective, and recovery point objective. Downtime cost figures are drawn from the Uptime Institute’s Annual Outage Analysis 2024 and ITIC’s 2024 Hourly Cost of Downtime survey of more than 1,000 organizations. Standards context is from ISO 22301. Figures are cited to their original sources and used to illustrate the purpose and economics of a BIA, not as guaranteed outcomes for any specific business.
Sources: Ready.gov, Business Impact Analysis | NIST SP 800-34 Rev. 1 | Uptime Institute, Annual Outage Analysis 2024 | ITIC, 2024 Hourly Cost of Downtime | ISO 22301
Get a Free IT and Continuity Consultation



related posts
What Is IT Monitoring? A Guide for Businesses
October 23, 2026IT monitoring is the continuous practice of collecting and analyzing data from a business's technology, its…
What Is Log Analysis? How It Works and Why It Matters
October 23, 2026Log analysis is the practice of reviewing and interpreting the log files that computers, applications, and…
What Is ISO 27001? A Guide to the Information Security Standard
October 22, 2026ISO 27001 is the world's best-known standard for managing information security, and increasingly the certification customers…
What Is IT Asset Management (ITAM)? A Guide for Businesses
October 22, 2026IT asset management (ITAM) is the practice of tracking and managing an organization's hardware, software, and…